Topic
Types of Statistical Tests: Which Test to Use and When
What a statistical test does, the four main types and their nonparametric alternatives, a table that matches each test to your data, and one test run from start to finish.
By Hira Noor, BS Mathematics · Updated · 11 min read
Definition
A statistical test uses sample data to decide between two hypotheses about a population: the null hypothesis (no effect or no difference) and the alternative. The main types of statistical tests are comparison tests (t-tests, ANOVA and their nonparametric versions), correlation tests (Pearson, Spearman), regression tests (linear and logistic), and tests of categorical data (chi-square, Fisher’s exact). Each type is either parametric, assuming a distribution such as the normal, or nonparametric, working on ranks or counts.
Key takeaways
- Every statistical test turns your data into a test statistic (t, F, χ², r or z) and a p-value, then compares the p-value with a significance level such as 0.05.
- Comparison tests ask whether groups differ, correlation tests ask whether two variables move together, regression tests ask whether one variable predicts another, and chi-square tests ask whether categories are related.
- Parametric tests (t-test, ANOVA, Pearson r) assume roughly normal data; each has a nonparametric alternative (Mann-Whitney U, Kruskal-Wallis, Spearman) for skewed data, ranks or small samples.
- The right test depends on three things: your goal, the type of your outcome variable, and how many groups you have and whether they are paired.
- A t-test is a special case of ANOVA: with two groups, one-way ANOVA gives F = t² and the same p-value.
- A p-value says how surprising the data are under H₀. Report it with an effect size, because a significant result can still be a tiny effect.
On this page
- What is a statistical test?
- The main types of statistical tests
- Parametric vs nonparametric tests
- Statistical tests at a glance
- How to choose the right statistical test
- Worked example: choosing and running a test
- Is a t-test an ANOVA?
- One-tailed vs two-tailed tests
- How to interpret and report a statistical test
- Common mistakes with statistical tests
- Statistical tests guides
- FAQ
What is a statistical test?
A statistical test (also called a hypothesis test or significance test) is a formal way to decide whether a pattern in a sample is strong enough to say it exists in the population, or whether chance alone could easily explain it. You start with a null hypothesis (H₀), which says there is no effect: two means are equal, two variables are unrelated, a proportion equals some value. The alternative hypothesis (H₁) says there is an effect.
The test then summarizes how far your data sit from what H₀ predicts in one number, the test statistic, and converts it to a p-value: the probability of a result at least this extreme if H₀ were true. If the p-value is at or below your significance level α (usually 0.05), you reject H₀. What Is a P-Value? Meaning, Calculation and Common Mistakes explains what that number does and does not mean.
- 1. State H₀ and H₁For example, H₀: μ₁ = μ₂ and H₁: μ₁ ≠ μ₂.
- 2. Choose α and the testUsually α = 0.05; the test follows from your data type and design.
- 3. Compute the statistict, F, χ², r or z from your sample.
- 4. Get the p-valueOr compare the statistic with a critical value.
- 5. Decide and reportReject H₀ if p ≤ α; add an effect size.
Statistical tests belong to inferential statistics: they use a sample to say something about a population. Summaries of the sample itself, such as a mean or a standard deviation, are descriptive. Descriptive vs Inferential Statistics: Differences and Examples covers the difference.
The main types of statistical tests
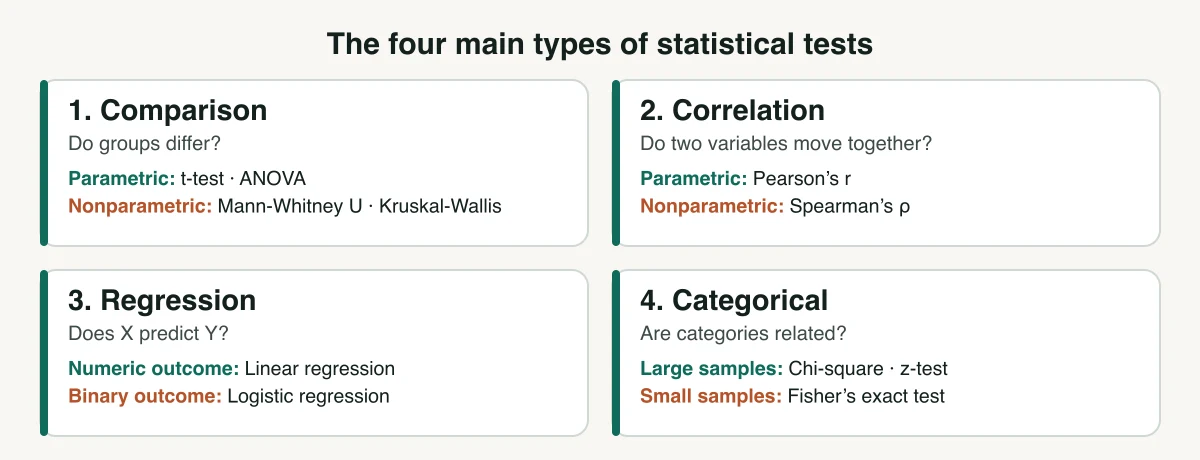
Textbooks group statistical tests by the question they answer. Four families cover almost every test you will meet in an introductory or applied course, and a fifth group checks the assumptions the others rely on.
| Type | Question it answers | Common tests |
|---|---|---|
| Comparison of means | Do groups differ on a numeric outcome? | t-tests, z-test, ANOVA; Mann-Whitney U, Wilcoxon, Kruskal-Wallis |
| Correlation | Do two numeric variables move together? | Pearson’s r test, Spearman’s rank correlation |
| Regression | Does one or more variables predict an outcome? | Simple and multiple linear regression, logistic regression |
| Categorical (frequency) | Are categories related, or do counts match expectations? | Chi-square test of independence, chi-square goodness of fit, Fisher’s exact test, proportion z-tests |
| Assumption checks | Are the data normal? Are variances equal? | Shapiro-Wilk, Kolmogorov-Smirnov, Levene’s test, F-test for variances |
1. Comparison tests
Comparison tests check whether the mean (or median) of a numeric outcome differs between groups, or from a known value. Which one you use depends on how many groups you have and whether the measurements are independent or paired.
| Test | Use it when | Calculator |
|---|---|---|
| One-sample t-test | One group’s mean against a known or target value | One-sample t-test |
| Independent samples t-test | Two separate groups, roughly equal variances | Independent t-test |
| Welch’s t-test | Two separate groups, unequal variances or sizes | Welch’s t-test |
| Paired t-test | The same subjects measured twice (before and after, matched pairs) | Paired t-test |
| z-test | Means with a known population SD, or large samples | z-test |
| One-way ANOVA | Three or more independent groups, one factor | ANOVA |
| Two-way ANOVA | Two factors at once, plus their interaction | Two-way ANOVA guide |
The step-by-step guides cover each one with a worked example: One-Sample t-Test: Formula, Assumptions and Worked Example, Independent Samples t-Test: Formula, Assumptions and Worked Example, Paired t-Test: Formula, Assumptions and Worked Example and One-Way ANOVA: Definition, Formulas and a Worked Example by Hand.
2. Correlation tests
A correlation test asks whether the relationship between two numeric variables in your sample is strong enough to say it exists in the population (H₀: ρ = 0). Pearson’s r measures straight-line association and assumes both variables are roughly normal. Spearman’s rank correlation works on ranks, so it handles skewed data, outliers and ordinal scales, and detects any monotonic trend. Use the Pearson’s Correlation Test Calculator or the Spearman Correlation Calculator.
3. Regression tests
Regression goes one step past correlation: it models how an outcome changes as a predictor changes, and tests whether each slope differs from zero. Simple linear regression has one numeric predictor, multiple linear regression has several, and logistic regression is used when the outcome is binary (yes or no, pass or fail). Try the Linear Regression Calculator, Multiple Linear Regression Calculator or Logistic Regression Calculator.
4. Tests for categorical data
When the outcome is a category rather than a number, you test counts or proportions. The chi-square test of independence checks whether two categorical variables are related, using a contingency table. The chi-square goodness-of-fit test checks whether one variable’s counts match an expected distribution. Fisher’s exact test replaces the chi-square test for small 2 × 2 tables (expected counts under 5). The one- and two-proportion z-tests compare a single proportion with a target, or two proportions with each other. See the Chi-Square Test of Independence Calculator, Chi-Square Goodness of Fit Calculator, Fisher’s Exact Test Calculator and Two Proportion Z-Test Calculator.
5. Tests that check assumptions
Some tests are run before the main analysis to check whether its assumptions hold. The Shapiro-Wilk test and Kolmogorov-Smirnov test check normality; Levene’s test and the F-test for two variances check whether groups have equal spread. A significant result here is a warning sign, not a finding: it points you to Welch’s t-test or a nonparametric test instead.
Parametric vs nonparametric tests
Parametric tests assume the data (or the sampling distribution of the mean) follow a known distribution, usually the normal, and test parameters such as the mean. Nonparametric tests make fewer assumptions: most of them rank the data and compare ranks or medians. Parametric tests are more powerful when their assumptions hold. Nonparametric tests are safer for small samples, clear skew, outliers or ordinal data such as Likert ratings.
| Situation | Parametric test | Nonparametric alternative |
|---|---|---|
| One group against a value | One-sample t-test | Wilcoxon signed-rank test (one-sample) |
| Two independent groups | Independent samples t-test | Mann-Whitney U test (Wilcoxon rank-sum) |
| Two paired measurements | Paired t-test | Wilcoxon signed-rank test |
| Three or more independent groups | One-way ANOVA | Kruskal-Wallis H test |
| Three or more repeated measurements | Repeated measures ANOVA | Friedman test |
| Association of two numeric variables | Pearson’s r | Spearman’s ρ or Kendall’s τ |
Statistical tests at a glance
This table lists the tests by the kind of data they need. Find the row that matches your outcome and predictor, then open the calculator to run the test with every step shown.
| Outcome variable | Predictor or groups | Test | Example question |
|---|---|---|---|
| Numeric | None (one sample vs a value) | One-sample t-test | Is the mean fill weight 500 g? |
| Numeric | 2 independent groups | Independent t-test or Mann-Whitney U | Do two teaching methods give different scores? |
| Numeric | 2 paired measurements | Paired t-test or Wilcoxon signed-rank | Did blood pressure fall after treatment? |
| Numeric | 3+ independent groups | One-way ANOVA or Kruskal-Wallis | Do three fertilizers give different yields? |
| Numeric | Numeric | Pearson’s r, linear regression | Does study time predict exam score? |
| Binary | Numeric or several predictors | Logistic regression | Does age predict whether a customer renews? |
| Categorical | Categorical | Chi-square test or Fisher’s exact | Is smoking status related to region? |
| Categorical | None (counts vs expected) | Goodness of fit | Is a die fair? |
| Proportion | 1 or 2 groups | One-proportion or two-proportion z-test | Do two ad versions have different click rates? |
| Variance | 2 or more groups | F-test, Levene’s test | Is one machine more variable than another? |
How to choose the right statistical test
You can narrow the list to one test with three questions, asked in this order:
- What is your goal? Compare groups, measure a relationship, predict an outcome, or check whether counts match an expectation.
- What type is your outcome variable? Numeric (continuous), categorical (nominal), ordinal (ranked), or binary.
- How many groups, and are they independent or paired? One sample, two groups, or three or more; separate people or the same people measured twice.
Then check the assumptions (normality, equal variances, independence) and switch to Welch’s or a nonparametric test if they fail. How to Choose the Right Statistical Test walks through each decision with an interactive chooser and a 23-row decision table.
Try it: T-Test CalculatorNot sure which t-test you need? This calculator runs the one-sample, two-sample and paired versions from the same screen.Worked example: choosing and running a test
Here is the whole process on one small dataset, from picking the test to reporting the result. Every number can be checked in the Independent Samples t-Test Calculator.
Exam scores under two teaching methods
Problem. Five students taught with method A score 72, 75, 78, 80 and 85. Five different students taught with method B score 80, 83, 86, 88 and 93. Do the two methods give different mean scores at α = 0.05?
- 01Choose the test. Goal: compare groups. Outcome: numeric (score). Design: two independent groups. That points to the independent samples t-test, with Mann-Whitney U as the fallback if the data look far from normal.
- 02Hypotheses. H₀: μ_A = μ_B. H₁: μ_A ≠ μ_B (two-tailed).
- 03Describe each group. Method A: mean 78, SD 4.95. Method B: mean 86, SD 4.95. The SDs are equal, so the pooled (Student) version fits.
- 04Pooled SD and standard error. s_p = √[(4 × 24.5 + 4 × 24.5) / 8] = 4.95. SE = s_p × √(1/5 + 1/5) = 4.95 × 0.632 = 3.13.
- 05Test statistic. t = (86 − 78) / 3.13 = 2.56, with df = 5 + 5 − 2 = 8.
- 06p-value. For t = 2.56 with 8 df, the two-tailed p = 0.034. The critical value is t* = 2.306, and 2.56 is beyond it.
- 07Effect size. Cohen’s d = 8 / 4.95 = 1.62, a large effect.
Answer. p = 0.034 is below 0.05, so reject H₀. Method B students scored 8 points higher on average, t(8) = 2.56, p = 0.034, d = 1.62. With only five students per group, the estimate is imprecise, so a larger study should confirm it.
Is a t-test an ANOVA?
Not by name, but mathematically a two-group t-test is a special case of one-way ANOVA. Run a one-way ANOVA on the two groups in the worked example and you get F = 6.53, which is exactly t² = 2.56², with the same p-value of 0.034. The difference is reach: a t-test compares only two means, while ANOVA compares any number of groups in one test.
That is why you should not run several t-tests on three or more groups. Each test carries a 5% chance of a false positive, so three pairwise tests push the overall chance of at least one Type I error to about 14%. ANOVA tests all groups at once at α = 0.05, and a post-hoc test such as Tukey’s HSD then shows which pairs differ. Type I vs Type II Errors (Type 1 vs Type 2): Definitions and Examples explains the two kinds of error, and One-Way vs Two-Way ANOVA: Differences and When to Use Each compares the two ANOVA designs.
One-tailed vs two-tailed tests
A two-tailed test asks whether there is a difference in either direction (H₁: μ₁ ≠ μ₂). A one-tailed test asks about one direction only (H₁: μ₁ > μ₂). A one-tailed test has more power in its chosen direction, but you must pick it before you see the data, and it cannot detect an effect the other way. Two-tailed tests are the default in most journals. A one-tailed p-value is half the two-tailed one when the effect points the predicted way, which is why switching after the fact is a common form of p-hacking.
How to interpret and report a statistical test
The decision rule is the same for every type of test: compare the p-value with the significance level you chose before the analysis.
- p ≤ α: reject H₀. The data are unlikely under “no effect”. This does not prove H₁ or show that the effect is large.
- p > α: fail to reject H₀. You did not find evidence of an effect; that is not the same as showing there is none, especially with a small sample.
- Always add an effect size (Cohen’s d, η², r, an odds ratio) and, where possible, a confidence interval. The Effect Size Calculator computes the common ones.
- Report the statistic, df and exact p, for example t(8) = 2.56, p = 0.034, rather than just “p < 0.05”. The P-Value Calculator turns any z, t, χ² or F into an exact p-value.
Common mistakes with statistical tests
- Using an independent test on paired data. Before-and-after measurements on the same people need a paired test; an independent t-test throws away the pairing and loses power.
- Running many t-tests instead of ANOVA. Multiple comparisons inflate the false-positive rate.
- Treating “not significant” as “no difference”. A small sample can miss a real effect (a Type II error).
- Ignoring assumptions. A t-test on heavily skewed data from 6 people, or a chi-square test with expected counts under 5, can give a misleading p-value.
- Confusing the standard deviation with the standard error. SD describes spread in the data; SE describes the precision of the mean. Tests use the SE.
- Choosing the test after seeing the results. Pick the test, the tails and α before the analysis.
Statistical tests guides
Each guide takes one part of statistical tests further, with formulas and worked examples.
- Statistical Tests
How to Choose the Right Statistical Test
Match your question, your variable types and your study design to the right test in three decisions.
13 min read - Statistical TestsStatistical Tables & Critical Values
What Is a P-Value? Meaning, Calculation and Common Mistakes
A plain-language definition of the p-value, how it is computed, what 0.05 and 0.01 mean, and how not to misread it.
11 min read - Statistical TestsStatistical Tables & Critical Values
One-Way ANOVA: Definition, Formulas and a Worked Example by Hand
Compute SSB, SSW, F and the p-value for three or more groups, then read the ANOVA table and report the result.
14 min read - Statistical Tests
Independent Samples t-Test: Formula, Assumptions and Worked Example
Compare two separate groups: when to use it, pooled vs Welch, the requirements, and a full example by hand.
12 min read - Statistical TestsStatistical Tables & Critical Values
One-Sample t-Test: Formula, Assumptions and Worked Example
Test one mean against a claimed value when the population SD is unknown.
10 min read - Statistical Tests
Paired t-Test: Formula, Assumptions and Worked Example
Before-and-after and matched-pair data: test the mean of the differences.
11 min read - Statistical Tests
Two-Way ANOVA: Main Effects, Interaction and a Worked Example
Two factors at once: main effects, the interaction, and how to read the ANOVA table.
15 min read - Statistical Tests
One-Way vs Two-Way ANOVA: Differences and When to Use Each
One factor or two? What changes in the hypotheses, the formulas, the table and the interpretation.
11 min read - Statistical TestsStudy Design & Sample Size
Type I vs Type II Errors (Type 1 vs Type 2): Definitions and Examples
False positives, false negatives, and how α, β, power and sample size connect them.
14 min read
Frequently asked questions
What are the main types of statistical tests?
What does a statistical test do?
Is a t-test an ANOVA?
What is the difference between parametric and nonparametric tests?
When should you use SD vs SEM?
What are the 5 basic statistics?
What is the most common statistical test?
Further reading
Cite this page
Statculator. (2026, November 14). Types of Statistical Tests: Which Test to Use and When. Retrieved November 14, 2026, from https://statculator.com/learn/topics/statistical-tests/