Topic
Study Design in Statistics: Types, Steps and Examples
What study design is, the four main types and when to use each, the seven steps of an experiment, how to sample and size a study, and how the design decides the statistical test.
By Hira Noor, BS Mathematics · Updated · 11 min read
Definition
Study design in statistics is the plan for how you collect data to answer a research question: who you study, how you choose them, what you measure, when you measure it and whether you assign a treatment. The four main types are experimental studies (such as randomized controlled trials), cohort studies, case-control studies and cross-sectional studies. Only a randomized experiment can show cause and effect on its own; the other three are observational and show association. The design decides which statistical test you can use and how many participants you need.
Key takeaways
- Study design is decided before any data are collected, and it limits every conclusion you can draw afterwards.
- The first split is who assigns the exposure: in an experiment the researcher does; in an observational study nature or the participants do.
- The four main types are experimental (randomized controlled trial), cohort, case-control and cross-sectional.
- Good experiments rest on four principles: control, randomization, replication and blocking, plus blinding where possible.
- How you sample decides who your results apply to; a random sample supports inference to the population, a convenience sample does not.
- Plan the sample size in advance: a survey at 95% confidence and ±5% needs 385 people, and comparing two means with d = 0.5 at 80% power needs about 63 per group.
On this page
- What is study design in statistics?
- The four main types of study design
- Observational vs experimental studies
- Which study design should you use?
- The 7 steps of experimental design
- Principles of experimental design
- Sampling methods: choosing who is in the study
- How many participants? Sample size in study design
- How study design determines the statistical test
- Common sources of bias in study design
- Study design & sample size guides
- FAQ
What is study design in statistics?
A study design (also called a research design) is the blueprint that links a question to data. It fixes the population you want to learn about, the sample you will actually measure, the variables (the exposure or treatment and the outcome), the timing of measurement and the method of assignment. Statistics comes in at two points: at the planning stage, where it sets the sampling method and the sample size, and at the analysis stage, where the design tells you which test or model is valid.
Design matters more than analysis because analysis cannot repair it. A biased sample stays biased however clever the test, and an observational study cannot become proof of cause and effect after the fact. That is why statisticians ask to be involved before data collection, not after. If the terms population, sample and parameter are new, start with Population vs Sample: Definitions, Differences and Examples and Parameter vs Statistic: Difference, Symbols and Examples.
The four main types of study design
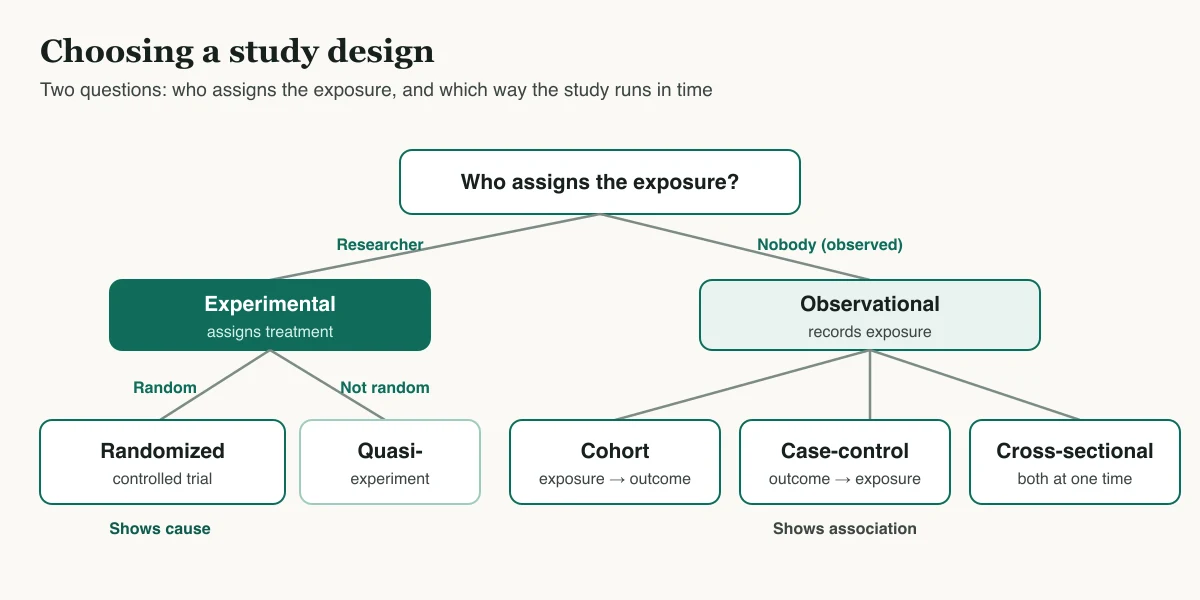
Ask one question first: did the researcher assign the exposure? If yes, it is an experiment. If no, it is observational, and the direction in time sorts it further. Following people forward from exposure to outcome is a cohort study; starting from the outcome and looking back for exposure is a case-control study; measuring both at one moment is a cross-sectional study.
| Design | How it works | What it measures | Can show cause? | Example |
|---|---|---|---|---|
| Experimental (randomized controlled trial) | Researcher randomly assigns treatment or control, then measures the outcome | Effect of the treatment (difference in means or risks) | Yes, if well randomized and controlled | 200 patients randomly given a new drug or a placebo; blood pressure compared after 8 weeks |
| Cohort (prospective or retrospective) | Groups defined by exposure are followed to see who develops the outcome | Incidence and relative risk | No, but strong evidence of association and timing | Smokers and non-smokers followed for 10 years to compare rates of lung disease |
| Case-control | People with the outcome (cases) are compared with similar people without it (controls) on past exposure | Odds ratio | No; prone to recall and selection bias | 100 people with a rare cancer and 200 matched controls asked about past chemical exposure |
| Cross-sectional | Exposure and outcome measured once, at the same time, in a sample | Prevalence and association | No; cannot tell which came first | A survey of 1,000 adults on screen time and sleep quality |
Two smaller families sit around these four. Descriptive studies (case reports, case series and descriptive surveys) describe what happens without a comparison group and often generate the hypothesis that a later study tests. Quasi-experiments assign a treatment without randomization, for example giving a new teaching method to one school and comparing it with another, and they sit between experiments and cohort studies in strength. At the top, systematic reviews and meta-analyses pool several studies of the same question.
Observational vs experimental studies
In an observational study you record what already happens: who smokes, who exercises, who buys what. In an experimental study you impose the treatment. The difference is not about the size or quality of the data but about confounding: a third variable that is linked to both the exposure and the outcome. People who choose to exercise also tend to eat differently and smoke less, so an observed link between exercise and heart health mixes several causes. Random assignment breaks those links on average, which is why an experiment can isolate the effect of the treatment.
| Observational study | Experimental study | |
|---|---|---|
| Who assigns the exposure | Participants, circumstances or nature | The researcher |
| Main threat | Confounding and selection bias | Poor randomization, dropout, lack of blinding |
| Conclusion you can draw | Association | Cause and effect |
| When it is the only option | Harmful exposures (smoking), rare outcomes, long time spans | When assigning the treatment is ethical and practical |
| Typical cost and speed | Often cheaper and faster (except long cohorts) | Often slower and more expensive |
Which study design should you use?
Start from the question and the constraints, not from the design you know best. The usual ranking of evidence puts systematic reviews first, then randomized controlled trials, then cohort, case-control and cross-sectional studies, then case reports, but the strongest design is often not ethical or affordable. Pick the strongest one your situation allows.
| Your situation | Design that usually fits | Why |
|---|---|---|
| You want to know if a treatment or change causes a better outcome, and you can assign it | Randomized controlled trial | Randomization removes confounding, so a difference can be read as an effect |
| The exposure is harmful or cannot be assigned (smoking, pollution) | Cohort study | Follows exposed and unexposed people forward and gives relative risk |
| The outcome is rare or takes years to appear | Case-control study | Starts from the few cases instead of waiting for them |
| You need a snapshot: how common something is right now | Cross-sectional survey | One round of measurement gives prevalence quickly and cheaply |
| You can assign the change but not at random (whole schools, policies) | Quasi-experiment | Compares treated and untreated groups; adjust for differences at baseline |
| Each person can try every treatment and the effect wears off | Crossover or matched-pairs design | Each person is their own control, so fewer participants are needed |
The 7 steps of experimental design
Textbooks number the steps differently (five, six or seven), but they cover the same ground. Here is the seven-step version, with what statistics contributes at each one.
- State the research question in a form data can answer: “Does a 10-minute daily practice app raise exam scores?” rather than “Does the app help?”
- Write the hypotheses. The null hypothesis H₀ says there is no effect (mean score with the app = mean score without it); the alternative H₁ says there is one.
- Define the variables. The independent variable is what you change (app or no app); the dependent variable is what you measure (exam score). List the variables you will hold constant or record as possible confounders, such as prior grades.
- Design the treatments and control. Decide the treatment groups, what the control group receives (no app, or a placebo app), and whether the design is between-subjects (different people in each group) or within-subjects (each person tries both, as in a paired design).
- Choose the sample and the sample size. Define the population, pick a sampling method and calculate how many participants you need for adequate power (see the worked example below).
- Assign participants at random to the groups, and blind participants and assessors where you can, so neither expectations nor choices decide who gets the treatment.
- Measure, then analyze with the test the design implies. Collect the outcome the same way in every group, then run the test you planned in advance, report the effect size with a confidence interval and the p-value, and state any deviations from the plan.
Principles of experimental design
R. A. Fisher’s agricultural experiments in the 1920s and 1930s set out the principles that most designed experiments still follow.
- Control: compare the treatment with a control group that differs only in the treatment, so the comparison has a baseline.
- Randomization: use chance to assign units to groups. It balances known and unknown confounders on average and justifies the p-value. The Random Number Generator can produce an allocation list.
- Replication: apply each treatment to enough units that chance variation can be estimated and averaged out. Replication is what the sample size calculation sets.
- Blocking: group similar units (same field, same age band, same lab) and randomize within each block, which removes that source of variation from the error. A two-way ANOVA analyzes a blocked design.
- Blinding: keep participants (single-blind) and also the people measuring the outcome (double-blind) unaware of who got which treatment, so expectations cannot shift the results.
Sampling methods: choosing who is in the study
Random assignment decides who gets the treatment; random sampling decides who is in the study at all. The first supports conclusions about cause, the second supports generalizing to the population. A randomized trial run on volunteers from one hospital shows the drug works for patients like them, not necessarily for everyone. The sampling method sets who your results apply to.
| Method | How it works | Best for | Watch out for |
|---|---|---|---|
| Simple random | Every member of the population has the same chance of selection | Small, well-listed populations | Needs a complete list (sampling frame) |
| Stratified | Split the population into groups (strata) and sample randomly within each | Making sure small subgroups are represented | Weight the results if strata are sampled unequally |
| Cluster | Randomly pick whole groups (schools, villages) and study everyone in them | Spread-out populations with no full list | People in a cluster are alike, so you need a larger sample |
| Systematic | Pick every k-th unit from a list after a random start | Lists, production lines | A hidden pattern in the list can bias it |
| Convenience | Study whoever is easy to reach | Pilot studies only | Results do not generalize; not a probability sample |
How many participants? Sample size in study design
Too small a sample wastes the study: real effects go undetected because power is low, which is a Type II error. Too large a sample wastes money and, in a trial, exposes more people than needed to an untested treatment. The calculation depends on the design. For estimating a proportion you need the confidence level and margin of error; for comparing groups you also need the significance level α, the power (1 − β) and the effect size you want to detect.
Sample size for a survey and for a two-group experiment
Problem. A college wants to estimate the share of its 2,000 students who use a study app, to within ±5 percentage points at 95% confidence. Then it plans an experiment to test whether the app raises exam scores by half a standard deviation (d = 0.5) at α = 0.05 (two-sided) with 80% power.
- 01Survey, infinite population: n₀ = z² · p(1 − p) / e² = 1.96² × 0.5 × 0.5 / 0.05² = 384.16, which rounds up to 385. Using p = 0.5 gives the largest, safest answer when you have no earlier estimate.
- 02Finite population correction for N = 2,000: n = n₀ / (1 + (n₀ − 1) / N) = 384.16 / (1 + 383.16 / 2,000) = 384.16 / 1.1916 = 322.4, so survey 323 students.
- 03Experiment, two independent means: n per group = 2(z₁₋α/₂ + z₁₋β)² / d² = 2 × (1.960 + 0.842)² / 0.5² = 2 × 7.849 / 0.25 = 62.8, so 63 per group, 126 in total.
- 04Allow for dropout: if 10% of students may not sit the exam, recruit 63 / 0.9 = 70 per group.
Answer. Survey 323 of the 2,000 students for the usage estimate, and randomize about 140 students (70 per group) for the experiment. The exact t-based calculation gives 64 per group, one more than the normal approximation, which is why the two kinds of calculator can differ by a participant or two.
For quick survey planning you can also use Cochran’s formula, Slovin’s formula or Yamane’s formula, and the Margin of Error Calculator shows how precise a sample you already have is. For an experiment, the Effect Size Calculator turns earlier results into the d you plug into the power calculation.
How study design determines the statistical test
The design fixes the structure of the data, and the structure picks the test. Independent groups need an independent-samples test; the same people measured twice need a paired test; a case-control study can estimate an odds ratio but not a risk, because the researcher chose how many cases to include. The table pairs common designs with the usual first analysis; How to Choose the Right Statistical Test covers the full decision.
| Design and outcome | Usual analysis | Calculator |
|---|---|---|
| Two randomized groups, numeric outcome | Independent-samples t-test | Independent t-test |
| Same people before and after, or a crossover trial | Paired t-test | Paired t-test |
| Three or more groups, numeric outcome | One-way ANOVA | ANOVA |
| Two groups, yes/no outcome (trial or cohort) | Two-proportion z-test, relative risk | Two-proportion z-test |
| Case-control study | Odds ratio, chi-square test of independence | Chi-square test |
| Cross-sectional survey, two categorical variables | Chi-square test of independence | Chi-square test |
| Cross-sectional survey, two numeric variables | Correlation or regression | Correlation |
| Survey estimating one proportion or mean | Confidence interval | Confidence interval |
Common sources of bias in study design
- Selection bias: the sample differs from the population in a way linked to the outcome, for example an online survey that misses people without internet access.
- Confounding: a third variable drives both exposure and outcome. Randomization handles it in experiments; in observational studies, matching, stratification and regression can only adjust for confounders you measured.
- Recall bias: in case-control studies, cases tend to remember past exposures better than controls.
- Nonresponse and dropout: if the people who do not answer or who leave the study differ from those who stay, the results shift. Report response and dropout rates.
- Measurement bias: an unblinded assessor or a leading survey question pushes results in one direction.
- Survivorship bias: studying only those who made it through a process (successful firms, surviving patients) hides the cases that failed.
Study design & sample size guides
Each guide takes one part of study design & sample size further, with formulas and worked examples.
- Descriptive StatisticsStudy Design & Sample Size
Descriptive vs Inferential Statistics: Differences and Examples
Describing the data you have versus drawing conclusions about the data you do not.
9 min read - Statistical TestsStudy Design & Sample Size
Type I vs Type II Errors (Type 1 vs Type 2): Definitions and Examples
False positives, false negatives, and how α, β, power and sample size connect them.
14 min read - Study Design & Sample SizeDescriptive Statistics
Population vs Sample: Definitions, Differences and Examples
The whole group you care about versus the part you actually measure.
10 min read - Study Design & Sample SizeDescriptive Statistics
Parameter vs Statistic: Difference, Symbols and Examples
μ versus x̄, σ versus s, p versus p̂: which describes the population and which the sample.
9 min read
Frequently asked questions
What is meant by study design?
What are the four types of study design?
What are the 7 steps of experimental design?
What are the types of design in statistics?
What is the difference between an observational study and an experiment?
How do you choose a sample size for a study?
Further reading
- Swinscow, T. D. V. and Campbell, M. J., Statistics at Square One (The BMJ), chapter 13: Study design and choosing a statistical test
- NIST/SEMATECH e-Handbook of Statistical Methods, 5.1 Introduction to process improvement and experimental design
- OpenStax, Introductory Statistics 2e, 1.4 Experimental Design and Ethics
- Cochran, W. G. (1977). Sampling Techniques, 3rd ed. Wiley.
Cite this page
Statculator. (2026, November 14). Study Design in Statistics: Types, Steps and Examples. Retrieved November 14, 2026, from https://statculator.com/learn/topics/study-design/