One-Way vs Two-Way ANOVA: Differences and When to Use Each
One-way vs two-way ANOVA: factors, hypotheses, formulas, interaction effects, one dataset analysed both ways, a comparison table and when to use each.
By Hira Noor, BS Mathematics · Updated · 11 min read
Summary
One-way ANOVA compares the means of three or more groups defined by a single factor and produces one F test. Two-way ANOVA crosses two factors, so it produces three F tests: a main effect for each factor and their interaction. Use one-way ANOVA when the groups differ on one variable only; use two-way ANOVA when a second factor might explain variation or change the effect of the first.
Key takeaways
- One-way ANOVA: one factor, one null hypothesis, one F test. Two-way ANOVA: two factors, three null hypotheses, three F tests.
- Only a two-way design can test an interaction, that is, whether the effect of one factor depends on the level of the other.
- A relevant second factor takes its variation out of the error term, which can make the test of the first factor far more sensitive.
- Both methods need one numeric outcome, independent observations, roughly normal residuals and equal variances.
- Two groups need only a t-test (a one-way ANOVA on two groups gives F = t² and the same p-value), and repeated measurements on the same subjects need a repeated-measures design.
- Two-way ANOVA is the simplest factorial ANOVA; with three or more factors the same logic gives more main effects and more interactions.
On this page
- The key difference: one factor or two
- One-way vs two-way ANOVA comparison table
- Questions and hypotheses
- One-way and two-way ANOVA formulas side by side
- Two-way ANOVA versus one-way ANOVA on the same data
- Interaction: what only two-way ANOVA can show
- Design and sample size
- One-way ANOVA versus a t-test
- Factorial ANOVA and the three types of ANOVA
- When to use one-way vs two-way ANOVA
- Frequently asked questions
The key difference: one factor or two
A factor is a categorical variable that defines the groups, and the “way” in the name counts the factors. One-way ANOVA has one: the groups form a single row, such as three fertilizers. Two-way ANOVA has two, and the groups form a grid in which every level of the first factor is combined with every level of the second, such as two fertilizers under each of three watering schedules.
Both analyses have exactly one numeric outcome (growth, score, yield) and both compare means by partitioning variance. What changes is how many sources the variance is divided among, and therefore how many questions the analysis answers. Full treatments are in One-Way ANOVA: Definition, Formulas and a Worked Example by Hand and Two-Way ANOVA: Main Effects, Interaction and a Worked Example.
One-way vs two-way ANOVA comparison table
| Feature | One-way ANOVA | Two-way ANOVA |
|---|---|---|
| Factors (independent variables) | 1 | 2 |
| Outcome (dependent variable) | 1, numeric | 1, numeric |
| Groups compared | k levels of the factor | a × b cells |
| Null hypotheses and F tests | 1 | 3 (2 without replication) |
| Sources of variation | Between groups, within groups | Factor A, factor B, A × B interaction, error |
| Error degrees of freedom | N − k | ab(n − 1) in a balanced design |
| Interaction | Cannot be tested | Tested when each cell has 2 or more observations |
| Follow-up | Post-hoc comparisons such as Tukey’s HSD | Simple effects if the interaction is significant; otherwise post-hoc tests on main effects |
| Effect size | η² or ω² | Partial η² for each effect |
| Unequal group sizes | Handled by the standard formulas | Need Type II or III sums of squares |
| Example | Growth under three fertilizers | Growth under two fertilizers × three watering schedules |
The assumptions are the same in both: independent observations, approximately normal residuals and equal variances across groups or cells. Check the last two with the Shapiro–Wilk test on the residuals and Levene’s test.
Questions and hypotheses
| Analysis | Question | Null hypothesis |
|---|---|---|
| One-way | Do the k group means differ? | μ₁ = μ₂ = … = μₖ |
| Two-way: main effect of A | Averaged over B, do the means differ across the levels of A? | All A-level means are equal |
| Two-way: main effect of B | Averaged over A, do the means differ across the levels of B? | All B-level means are equal |
| Two-way: interaction | Does the effect of A depend on the level of B? | The effect of A is the same at every level of B |
A one-way ANOVA ends with one F statistic, F = MSB / MSW. A two-way ANOVA ends with three, each dividing an effect’s mean square by the same error mean square. In both, a significant F says that some means differ without saying which; follow-up comparisons answer that.
One-way and two-way ANOVA formulas side by side
Both analyses split the total sum of squares (SST, the squared deviations of every observation from the grand mean x̄) into parts. One-way ANOVA uses two parts. Two-way ANOVA, written here for a balanced design with a levels of factor A, b levels of factor B and n observations per cell, uses four.
Here x̄ᵢ.. is the mean of level i of factor A, x̄.ⱼ. the mean of level j of factor B and x̄ᵢⱼ the mean of cell (i, j). The interaction term measures how far each cell mean sits from what the two main effects alone would predict. Every mean square is its SS divided by its df, and every F in the two-way table shares the same denominator, MSE.
Two-way ANOVA versus one-way ANOVA on the same data
Eighteen seedlings are grown with one of two fertilizers under one of three watering schedules, three seedlings per combination. Growth after four weeks is measured in centimetres. The grand mean is 8 cm.
| Fertilizer | Low water | Medium water | High water | Fertilizer mean |
|---|---|---|---|---|
| Standard | 4, 5, 6 | 4, 6, 8 | 6, 6, 9 | 6 |
| Enriched | 3, 6, 6 | 8, 10, 12 | 14, 14, 17 | 10 |
| Watering mean | 5 | 8 | 11 | 8 |
One-way ANOVA on watering alone
Problem. Ignore fertilizer and treat the data as three watering groups of six seedlings. Does mean growth differ by watering schedule at α = 0.05?
- 01Group means: low = 30 / 6 = 5, medium = 48 / 6 = 8 and high = 66 / 6 = 11. Grand mean = 144 / 18 = 8.
- 02Between groups: SSB = 6(5 − 8)² + 6(8 − 8)² + 6(11 − 8)² = 54 + 0 + 54 = 108.
- 03Within groups: the squared deviations from each group’s own mean total 8 for low (1 + 0 + 1 + 4 + 1 + 1), 40 for medium (16 + 4 + 0 + 0 + 4 + 16) and 108 for high (25 + 25 + 4 + 9 + 9 + 36), so SSW = 156.
- 04Degrees of freedom: 3 − 1 = 2 and 18 − 3 = 15. MSB = 108 / 2 = 54 and MSW = 156 / 15 = 10.4.
- 05F = 54 / 10.4 = 5.19, and the p-value from an F distribution with (2, 15) df is 0.0193. The critical value is 3.682.
Answer. Reject H₀: mean growth differs across watering schedules, F(2, 15) = 5.19, p = 0.019. The within-groups SS of 156 still contains everything fertilizer did.
The two-way analysis keeps the same watering sum of squares and divides the 156 further. With a = 2, b = 3 and n = 3, the formulas above give SSA = 9[(6 − 8)² + (10 − 8)²] = 72 for fertilizer, and the six cell means (5, 6, 7 and 5, 10, 15) give SSAB = 3 × 16 = 48 for the interaction, leaving SSE = 36 within the cells. The full calculation is worked step by step in the two-way ANOVA guide; the two finished tables are below.
| Source | SS | df | MS | F | p |
|---|---|---|---|---|---|
| Between groups (watering) | 108 | 2 | 54 | 5.19 | 0.0193 |
| Within groups | 156 | 15 | 10.4 | ||
| Total | 264 | 17 |
| Source | SS | df | MS | F | p |
|---|---|---|---|---|---|
| Fertilizer (A) | 72 | 1 | 72 | 24.00 | 0.0004 |
| Watering (B) | 108 | 2 | 54 | 18.00 | 0.0002 |
| Fertilizer × Watering | 48 | 2 | 24 | 8.00 | 0.0062 |
| Error | 36 | 12 | 3 | ||
| Total | 264 | 17 |
The totals match, and so does the watering row’s SS. The difference is the error line: the one-way within-groups SS of 156 splits into fertilizer (72), the interaction (48) and true within-cell error (36), and its 15 df split into 1 + 2 + 12. With fertilizer accounted for, the error mean square drops from 10.4 to 3, and the F for watering rises from 5.19 to 18.00.
A one-way analysis of fertilizer alone (two groups of nine) gives F(1, 16) = 6.00, p = 0.026, exactly the result of a pooled t-test, t(16) = 2.449. Both single-factor analyses are significant, and neither can show how the two factors work together.
The write-ups differ in the same way. A one-way result is one line: F(2, 15) = 5.19, p = .019, η² = .41. A two-way result reports every effect with its own df and partial η², starting with the interaction: fertilizer × watering F(2, 12) = 8.00, p = .006, partial η² = .57; watering F(2, 12) = 18.00, p < .001, partial η² = .75; fertilizer F(1, 12) = 24.00, p < .001, partial η² = .67.
Try it: ANOVA CalculatorRun the watering-only analysis: enter the low, medium and high groups (six values each) to reproduce SSB = 108, SSW = 156 and F = 5.19.Statculator’s calculator covers one-way designs; a two-way calculator is not available yet. For any F statistic computed by hand, the P-Value from F Calculator and the F Critical Value Calculator give the p-value and critical value.
Interaction: what only two-way ANOVA can show
| Fertilizer | Low water | Medium water | High water |
|---|---|---|---|
| Standard | 5 | 6 | 7 |
| Enriched | 5 | 10 | 15 |
| Enriched − standard | 0 | 4 | 8 |
The one-way result, “more water, more growth”, is true only on average. With the standard fertilizer, growth barely responds to watering (5, 6 and 7 cm); with the enriched fertilizer it triples (5, 10 and 15 cm). Seen from the other side, the enriched fertilizer adds nothing under low watering and 8 cm under high watering. That dependence is the interaction, and its F test (F = 8.00, p = 0.0062) shows it is larger than chance would readily produce.
An interaction plot shows the same thing at a glance: mean growth against watering level, one line per fertilizer. The two lines start together at 5 cm and fan apart to 7 and 15 cm. Parallel lines would mean no interaction.
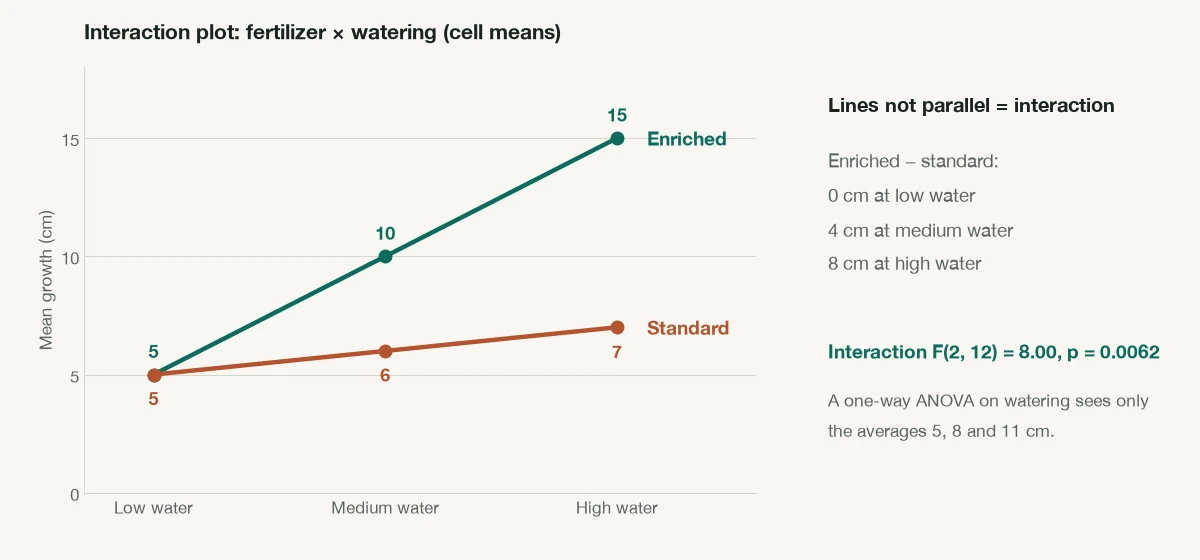
A one-way design has only one factor, so there is nothing for it to interact with. Even running a separate one-way ANOVA for each factor reports two averages and misses the pattern.
Design and sample size
- Cells multiply. A one-way design with k groups of n needs k × n subjects. A two-way design needs a × b × n: a 3 × 4 layout with 10 per cell is 12 cells and 120 subjects.
- Each observation does double duty. In the seedling example, 18 plants give fertilizer means based on 9 plants each and watering means based on 6 each. Two separate one-factor experiments with the same group sizes would need 18 + 18 = 36 plants and still could not test the interaction.
- Replication is required for the interaction. With one observation per cell there is no within-cell error, so only the two main effects can be tested, and only by assuming there is no interaction.
- Interactions need more data. An interaction is a difference between differences, which is estimated less precisely than a difference between two means. Studies planned around a main effect are often too small to detect an interaction of similar size.
- Balance matters more. Unequal group sizes are routine in one-way ANOVA. In two-way ANOVA, unequal cell sizes make the effects overlap, and the result depends on the type of sums of squares (I, II or III) the software uses.
- A second factor is not free. Each added effect takes degrees of freedom from the error term (15 fell to 12 above). A factor that explains almost nothing costs a little power instead of adding it.
One-way ANOVA versus a t-test
A one-way ANOVA with exactly two groups and an independent samples t-test are the same test. The F statistic equals the square of the pooled t statistic and the p-values match: in the seedling data, fertilizer alone gives F(1, 16) = 6.00 and t(16) = √6 = 2.449, both with p = 0.026. The t-test has two practical advantages for two groups: it can be one-tailed, and its Welch version does not assume equal variances.
With three or more groups the two part ways. Running a t-test for every pair inflates the chance of at least one false positive: with three groups and three tests at α = 0.05 it is close to 0.14, and with six groups and fifteen tests it is over 0.5. One-way ANOVA tests all the means at once at the chosen α, and post-hoc tests such as Tukey’s HSD then compare pairs with the error rate controlled.
Factorial ANOVA and the three types of ANOVA
A factorial ANOVA is any ANOVA in which two or more factors are crossed, so every combination of levels is observed. Two-way ANOVA is the simplest factorial ANOVA. A three-way ANOVA tests 3 main effects, 3 two-way interactions and 1 three-way interaction, 7 F tests in all, and in general k factors give 2ᵏ − 1 effects. A one-way ANOVA is therefore not factorial: with a single factor there is nothing to cross.
| Type | Factors | Groups | Typical question |
|---|---|---|---|
| One-way ANOVA | 1 between-subjects factor | Independent | Does mean yield differ across three fertilizers? |
| Two-way (factorial) ANOVA | 2 or more crossed factors | Independent | Do fertilizer and watering affect growth, and does the fertilizer effect depend on watering? |
| Repeated-measures ANOVA | 1 or more within-subjects factors | Same subjects measured repeatedly | Does blood pressure change across three visits? |
Lists of “the three types” vary between textbooks; some name factorial ANOVA or MANOVA (several dependent variables) as the third type instead of repeated measures. A design that mixes a between-subjects factor with a repeated factor is a mixed ANOVA.
When to use one-way vs two-way ANOVA
- Why use a one-way ANOVA? Your groups differ on one variable only, such as three teaching methods or four suppliers, and you want one test of whether any group mean differs instead of a string of pairwise t-tests.
- Why use a two-way ANOVA? Your groups are defined by two variables and every combination was observed. You want the effect of each variable with the other held in the design, a smaller error term, and a test of whether the effect of one depends on the other.
- Use neither with only two groups (a t-test), with the same subjects measured more than once (repeated measures), or with a skewed outcome and small groups (the Kruskal–Wallis test is the rank-based alternative to one-way ANOVA).
The four scenarios below apply the same two checks every time: count the factors, then ask whether the groups are independent.
Four email subject lines
Problem. An analyst sends four subject lines to four separate random samples of 50 customers and records each customer’s order value. Which analysis fits?
- 01Count the factors: one (subject line), with four levels.
- 02Check independence: each customer receives one subject line, so the groups are independent.
Answer. One-way ANOVA, with df = 3 and 196. If F is significant, Tukey’s HSD shows which subject lines differ.
Training plan and experience level
Problem. A gym compares three training plans among beginners and experienced members, ten members per combination, and records strength gain in kilograms. Which analysis fits?
- 01Count the factors: two, plan (3 levels) and experience (2 levels), fully crossed into 6 cells with N = 60.
- 02Identify the questions: does gain differ by plan, does it differ by experience, and does the best plan depend on experience?
Answer. Two-way ANOVA, with df = 2 for plan, 1 for experience, 2 for the interaction and 54 for error. The third question is the interaction, which a one-way analysis could not test.
Two diets
Problem. Forty volunteers are randomly split between two diets, and weight change after 12 weeks is compared. Which analysis fits?
- 01Count the factors and levels: one factor (diet) with only two levels.
- 02Two independent groups and one numeric outcome is the two-sample case.
Answer. Neither is needed. Use an independent samples t-test. A one-way ANOVA on two groups would give the same p-value, because F = t².
The same patients at three visits
Problem. Twelve patients have their blood pressure measured at baseline, 4 weeks and 8 weeks. Do the mean readings differ across visits?
- 01Count the factors: one (visit), with three levels.
- 02Check independence: the three sets of readings come from the same 12 people, so they are related, not independent.
Answer. Neither. Ordinary one-way and two-way ANOVA both assume independent groups. Use repeated-measures ANOVA, or a paired t-test if there are only two visits.
Frequently asked questions
What is the main difference between one-way and two-way ANOVA?
When should I use two-way ANOVA instead of one-way ANOVA?
Can I run two one-way ANOVAs instead of one two-way ANOVA?
Does two-way ANOVA have two dependent variables?
Is two-way ANOVA more powerful than one-way ANOVA?
Do one-way and two-way ANOVA have the same assumptions?
Are one-way ANOVA and a t-test the same?
What are the three types of ANOVA?
Further reading
- NIST/SEMATECH e-Handbook, 7.4.3: Are the means equal? (one-way ANOVA)
- NIST/SEMATECH e-Handbook, 7.4.3.7: The two-way ANOVA
- NIST/SEMATECH e-Handbook, 7.4.3.8: Models and calculations for the two-way ANOVA
- Penn State STAT 502: Analysis of Variance and Design of Experiments
- OpenStax, Introductory Statistics 2e, Chapter 13: F Distribution and One-Way ANOVA
Cite this page
Statculator. (2026, November 14). One-Way vs Two-Way ANOVA: Differences and When to Use Each. Retrieved November 14, 2026, from https://statculator.com/learn/one-way-anova-vs-two-way-anova/