Study Design & Sample SizeDescriptive Statistics
Parameter vs Statistic: Difference, Symbols and Examples
Parameter vs statistic: a parameter describes a whole population, a statistic a sample. Key differences, symbols (μ vs x̄, p vs p̂) and 8 worked examples.
By Hira Noor, BS Mathematics · Updated · 9 min read
Summary
A parameter is a number that describes an entire population, such as the population mean μ or proportion p. A statistic is a number calculated from a sample, such as the sample mean x̄ or proportion p̂. Parameters are fixed but usually unknown, because the whole population is rarely measured. Statistics are known and vary from sample to sample, and each one serves as an estimate of the matching parameter.
Key takeaways
- A parameter describes a population; a statistic describes a sample. The first letters match: P with P, S with S.
- Parameters are mostly Greek letters (μ, σ, σ², ρ) plus p and N; statistics are x̄, s, s², r, p̂ and n.
- A parameter is one fixed value. A statistic changes every time a new sample is drawn.
- To classify a number, ask which group the claim is about and whether every member of that group was measured.
- A percentage such as 50% or 3.7% can be either: the format of the number never decides, the group behind it does.
- Confidence intervals and hypothesis tests are statements about parameters, calculated from statistics.
On this page
- What is a parameter in statistics, and what is a statistic?
- Parameter vs statistic: key differences
- Symbols for parameters and statistics
- Examples of parameters and statistics
- How a statistic estimates a parameter
- Sampling variability: why a statistic changes
- How to tell if a value is a statistic or a parameter
- From statistics to parameters: confidence intervals and hypothesis tests
- Common mistakes
- Frequently asked questions
What is a parameter in statistics, and what is a statistic?
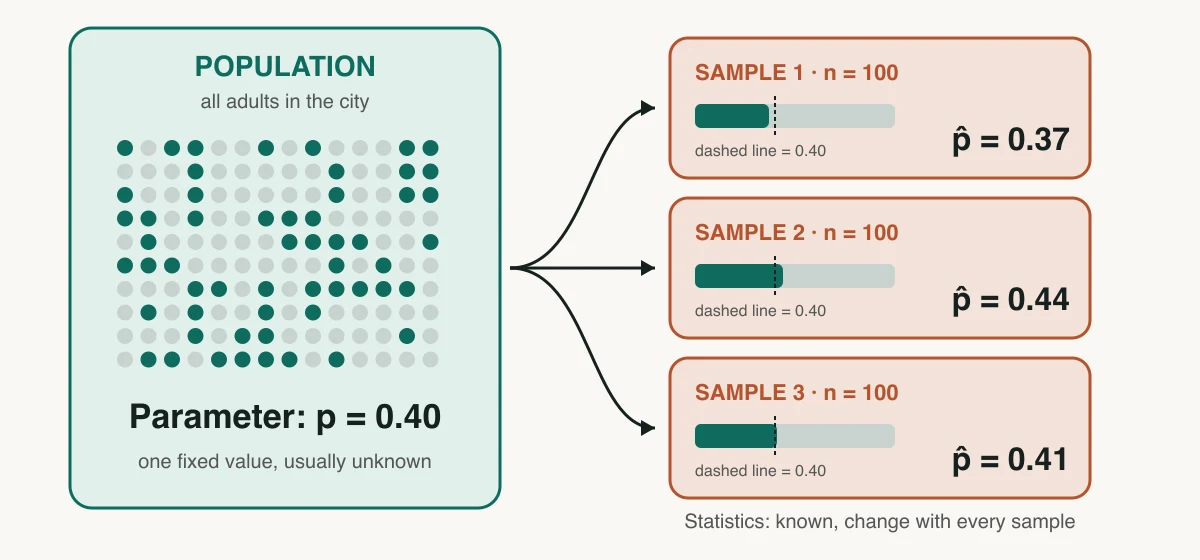
A parameter is a numerical summary of a population: the mean income of all households in a country, the proportion of all voters who support a candidate, the standard deviation of the weight of every bag a machine fills. It is a single fixed number. Because measuring a whole population is rarely possible, its value is usually unknown.
A statistic is a numerical summary of a sample: the mean income of 2,000 surveyed households, the proportion among 1,200 polled voters, the standard deviation of 36 weighed bags. You can always calculate it, and it would come out differently if you drew another sample.
The two come in matched pairs. Each statistic is the sample version of a parameter and is used to estimate it. The guide Population vs Sample: Definitions, Differences and Examples explains the two groups these numbers describe.
Parameter vs statistic: key differences
The table sets the two side by side. Most of the rows follow from one fact: a parameter belongs to the whole population, and a statistic belongs to one particular sample from it.
| Feature | Parameter | Statistic |
|---|---|---|
| Describes | A whole population | A sample drawn from the population |
| Value | One fixed number | Varies from sample to sample |
| Known? | Usually unknown; known only after a census | Always known once the data are collected |
| How it is obtained | Measure every member, or state it as a claim or target | Calculate it from the sample data |
| Notation | Mostly Greek letters: μ, σ, ρ, plus p and N | Latin letters or a hat: x̄, s, r, p̂, n |
| Role in inference | The unknown target of a test or interval | The estimate the test or interval is built from |
| Example | Mean height of every adult in Canada | Mean height of 500 surveyed Canadian adults |
Symbols for parameters and statistics
Notation tells you which is meant. Parameters are mostly written with Greek letters, and statistics with Latin letters or a hat (^) over the symbol.
| Quantity | Parameter (population) | Statistic (sample) | Calculator |
|---|---|---|---|
| Mean | μ (mu) | x̄ (x-bar) | Mean Calculator |
| Standard deviation | σ (sigma) | s | Standard Deviation Calculator |
| Variance | σ² | s² | Variance Calculator |
| Proportion | p (π in some textbooks) | p̂ (p-hat) | Proportion Confidence Interval Calculator |
| Correlation | ρ (rho) | r | Correlation Coefficient Calculator |
| Regression slope | β₁ | b₁ | Linear Regression Calculator |
| Size | N | n | — |
Two cautions. N and n are counts, not estimates of one another: the researcher chooses n. And the letter p is overloaded, since it can stand for a population proportion or for a p-value, so check the context.
Examples of parameters and statistics
Each row pairs a parameter with the statistic a researcher would use to estimate it. The population is what turns a number into a parameter; the sample is what turns it into a statistic.
| Field | Parameter (population) | Statistic (sample) |
|---|---|---|
| Elections | Proportion of all registered voters who back a candidate, p | Proportion among 1,200 voters in a poll, p̂ |
| Medicine | Mean blood pressure of every adult with hypertension, μ | Mean blood pressure of 250 trial patients, x̄ |
| Manufacturing | Standard deviation of the weight of every bag a line fills, σ | Standard deviation of 36 sampled bags, s |
| Education | Mean score of every student who sat a national exam, μ | Mean score of 80 students from one district, x̄ |
| Economics | Unemployment rate of the entire labor force, p | Unemployment rate in a monthly household survey, p̂ |
| Sports | Mean height of the 15 players on one team’s roster, μ | Mean height of 5 players picked from that roster, x̄ |
The last row shows that a parameter is not always out of reach. When the population is small and every member is measured, as with a team roster, a class list or a census, the parameter is known exactly.
How a statistic estimates a parameter
A statistic used to estimate a parameter is a point estimate: x̄ is the point estimate of μ, and p̂ of p. The rule that produces it is an estimator. A good estimator has two properties.
- It is unbiased: over many samples its values average out to the parameter. x̄ is unbiased for μ, and p̂ for p. The sample variance s² is unbiased for σ² because it divides by n − 1; dividing by n would give values that are too small on average, as Sample vs Population Standard Deviation: Which Should You Use? explains.
- It is precise: its values cluster tightly around the parameter. Precision improves as the sample size grows.
A point estimate on its own hides how far off it might be. Measuring that is the job of the standard error.
Sampling variability: why a statistic changes
Draw a second sample and the statistic changes, although the parameter has not moved. The pattern of values a statistic takes over all possible samples is its sampling distribution, and the standard deviation of that distribution is the standard error.
Go back to the library cards in the diagram, where p = 0.40. A random sample of n = 100 has SE(p̂) = √(0.40 × 0.60 / 100) = 0.0490, and about 95% of such samples give a p̂ between 0.304 and 0.496. With n = 400 the standard error halves to 0.0245 and the range narrows to 0.352 to 0.448. The parameter stays at 0.40 throughout; only the statistic moves.
| Sample size n | SE(p̂) | Range holding about 95% of sample proportions |
|---|---|---|
| 100 | 0.0490 | 0.304 to 0.496 |
| 400 | 0.0245 | 0.352 to 0.448 |
| 1,600 | 0.0122 | 0.376 to 0.424 |
In practice p and σ are unknown, so the standard error is estimated by substituting p̂ for p, or s for σ. The Standard Error Calculator and the Standard Error of Proportion Calculator do this from your data.
How to tell if a value is a statistic or a parameter
Three questions settle almost every case.
- Which group is the number about? Identify the population the statement refers to.
- Was every member of that group measured? If so, the number is a parameter. If it comes from only part of the group, it is a statistic.
- Is the number a claim or a measurement? A stated, assumed or hypothesized value for a whole group (“the label says 500 g”, “the national average is 7 hours”) is treated as a parameter, even though nobody measured everything.
Parameter or statistic? Eight statements classified
Problem. Decide whether the number in each statement is a parameter or a statistic, and give its symbol.
- 01A poll of 1,200 voters finds that 54% support a measure. Only part of the electorate was asked: statistic, p̂ = 0.54.
- 02In the vote itself, 51.3% of all ballots cast were in favour. Every ballot was counted: parameter, p = 0.513.
- 03The mean height of the 15 players on a team’s roster is 198 cm, and the question is about that team. All members were measured: parameter, μ = 198.
- 04Thirty-six bags taken from a filling line have a mean weight of 497 g. Part of the output: statistic, x̄ = 497.
- 05The filling machine is set so that bags average 500 g. A target for all bags: parameter, μ = 500 (a claimed value).
- 06The standard deviation of those 36 sampled bags is 8 g. Statistic, s = 8.
- 07In a sample of 85 students, hours of study and exam score have a correlation of 0.42. Statistic, r = 0.42.
- 08A census reports the average household size for the whole country. Every household is covered: parameter, μ.
Answer. Statements 1, 4, 6 and 7 are statistics, because each summarizes only part of the group of interest. Statements 2, 3, 5 and 8 are parameters, because each describes, or makes a claim about, the entire group.
The same number can change category when the question changes. The mean score of one class is a parameter in a report on that class, and a statistic in a study of all students taught by the same method.
Is a percentage like 50% or 3.7% a statistic or a parameter?
It can be either. A percentage is just a proportion written out of 100, so the same three questions apply. “50% of the 40 employees in this office work remotely,” where the office is the group of interest and everyone was counted, is a parameter. “50% of 400 surveyed employees work remotely,” used to describe all employees in a country, is a statistic.
Textbook problems often use a figure such as a 3.7% unemployment rate. In the United States the official rate comes from the Current Population Survey, a monthly sample of about 60,000 households, so the published figure is a statistic, p̂ = 0.037, that estimates the rate in the whole labor force (Bureau of Labor Statistics). It would be a parameter only if every member of the labor force had been counted.
From statistics to parameters: confidence intervals and hypothesis tests
Inferential statistics exists to bridge the two. Every hypothesis and every confidence interval is a statement about a parameter; every calculation behind them uses statistics. That is why hypotheses are written with Greek letters, H₀: μ = 500 and never H₀: x̄ = 500. There is nothing to test about x̄, because you can read its value straight from the data. The guide Descriptive vs Inferential Statistics: Differences and Examples covers this split between describing a sample and drawing conclusions about a population.
Bag weights: estimating and testing μ
Problem. A sample of 36 bags from the filling line has x̄ = 497 g and s = 8 g. The machine is meant to fill to μ = 500 g. What do the statistics say about the parameter?
- 01Statistics. x̄ = 497, s = 8 and n = 36. The standard error of the mean is s / √n = 8 / 6 = 1.3333.
- 02Confidence interval for the parameter. With 35 degrees of freedom the 95% t critical value is 2.0301, so the margin of error is 2.0301 × 1.3333 = 2.7068, and the interval for μ runs from 494.29 to 499.71 g.
- 03Hypothesis test about the parameter. For H₀: μ = 500 against H₁: μ ≠ 500, t = (497 − 500) / 1.3333 = −2.25, which gives a two-tailed p-value of 0.0308.
Answer. The statistic x̄ = 497 is known exactly. The parameter μ is not, but the data place it between about 494.3 and 499.7 g with 95% confidence, and they give evidence at the 5% level (p = 0.031) that it differs from the 500 g target.
You can reproduce the test with the One-Sample t-Test Calculator. For the reasoning behind the two procedures, see What Is a P-Value? Meaning, Calculation and Common Mistakes and One-Sample t-Test: Formula, Assumptions and Worked Example.
Common mistakes
- Writing hypotheses about statistics. H₀: x̄ = 500 is meaningless; hypotheses concern μ, p, σ or ρ.
- Treating a statistic as the parameter. “54% of voters support the measure” overstates what a poll shows. The poll gives p̂ = 0.54, and p lies somewhere within the margin of error.
- Using the population formula on sample data. Dividing by n where n − 1 belongs gives a variance that underestimates the population spread on average.
- Calling any number from a big dataset a parameter. Size is irrelevant. A million records are still a sample if the conclusion is about a wider group or a future period.
- Assuming a parameter can never be known. It can be, when the population is small and fully measured, as in a census or a complete class list.
- Confusing a statistical parameter with a function or model parameter. In everyday speech “parameter” can mean any setting or limit. In statistics it means a number that describes a population, or a constant in a probability model, such as μ and σ of a normal distribution.
Frequently asked questions
What is the difference between a parameter and a statistic?
What is a parameter in statistics?
What is an example of a parameter?
Is the mean a parameter or a statistic?
Is the standard deviation a parameter or a statistic?
Is 50% a statistic or a parameter?
What are the symbols for parameters and statistics?
Can a parameter change?
Why do we use statistics instead of parameters?
Further reading
Cite this page
Statculator. (2026, November 14). Parameter vs Statistic: Difference, Symbols and Examples. Retrieved November 14, 2026, from https://statculator.com/learn/parameter-vs-statistic/