Study Design & Sample SizeDescriptive Statistics
Population vs Sample: Definitions, Differences and Examples
Population vs sample in statistics: definitions, key differences, N vs n, variance and proportion formulas, 7 examples and how to tell which your data are.
By Hira Noor, BS Mathematics · Updated · 10 min read
Summary
A population is the entire group you want to draw conclusions about; a sample is the part of that group you actually observe. For example, all 340 employees of a company are a population, and 60 of them picked at random are a sample. Numbers that describe a population, such as μ and σ, are parameters and are usually unknown. Numbers computed from a sample, such as x̄ and s, are statistics and are used to estimate them. A sample supports conclusions about its population only when it is chosen in a way that represents it, ideally at random.
Key takeaways
- Population: every member of the group of interest (size N). Sample: the members you measure (size n).
- Populations are described by parameters (μ, σ, p); samples by statistics (x̄, s, p̂) that estimate them.
- The population variance divides by N; the sample variance divides by n − 1.
- A larger random sample reduces sampling error, but no sample size fixes a biased selection method.
- Whether data are a population or a sample depends on the question asked, not on how many values there are.
- A representative sample mirrors the population on the traits that matter; random selection is the only method that achieves this without knowing those traits in advance.
On this page
- What are a population and a sample?
- Population vs sample: key differences
- Why we sample instead of measuring everyone
- Sampling methods in brief
- Population vs representative sample
- Describing the population and sample in a research paper
- Sampling error vs bias
- How the sample size is chosen
- How to tell if your data are a sample or a population
- Frequently asked questions
What are a population and a sample?
A population is the complete set of people, objects, events or measurements that a question is about. It does not have to be large or made up of people: the 12 machines in a workshop, every invoice a company issued last year and every lightbulb a factory will ever produce are all populations. The last one cannot even be listed, because it includes items that do not exist yet.
A sample is the subset of the population that is actually observed. A study measures the sample and uses it to say something about the population. The list the sample is drawn from, such as a customer database or an electoral roll, is the sampling frame. A sample that includes every member of the population is a census.
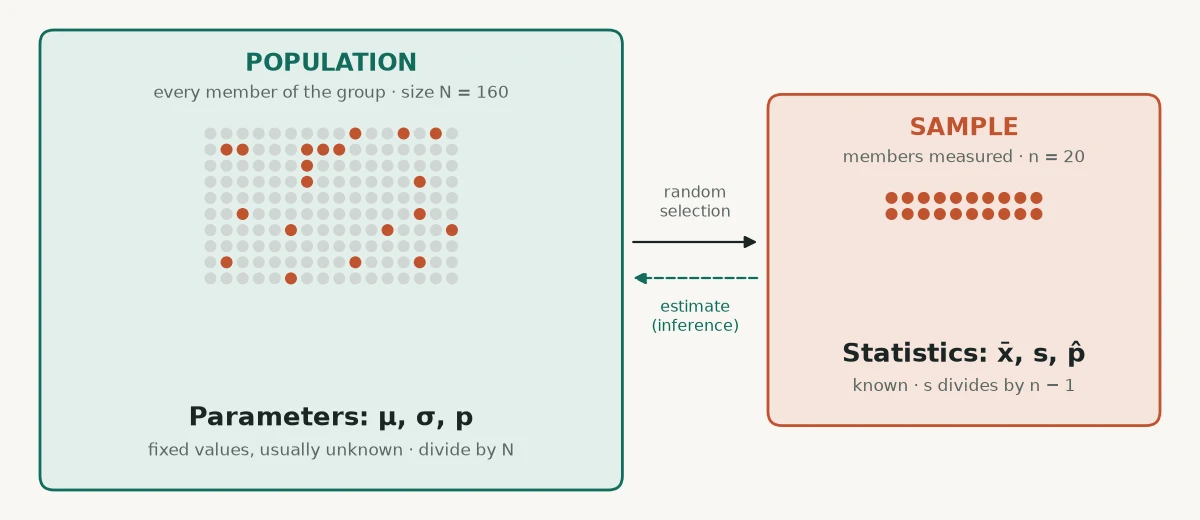
Whether you write population vs sample or sample vs population, the relationship is the same: the sample sits inside the population, and the whole point of collecting a sample and population summaries side by side is to learn about the larger group from the smaller one.
| Question | Population | Sample |
|---|---|---|
| What share of voters support a proposal? | All registered voters in the country | 1,200 voters reached by a random phone poll |
| How long do this factory’s batteries last? | Every battery the production line makes | 50 batteries taken from this week’s output and tested |
| What is the average commute at our company? | All 340 employees | 60 employees chosen at random from the payroll list |
| Does a drug lower blood pressure in adults with hypertension? | All adults with hypertension, now and in the future | 400 volunteers enrolled in a clinical trial |
| How many trout live in this lake? | Every trout in the lake | 150 trout caught, tagged and counted in a capture–recapture study |
| How fast does our website load for visitors? | Every page view, including future ones | 10,000 page views logged by the monitoring tool last week |
| How did my class do on the midterm? | The 28 students in the class | None needed: all 28 scores are available (a census) |
The same data can be either. The 28 midterm scores are a population if the question is about that class, and a sample if the teacher uses them to judge how the exam would suit students in general.
Population vs sample: key differences
| Aspect | Population | Sample |
|---|---|---|
| Definition | Every member of the group of interest | The subset that is observed |
| Size | N; often very large, unknown or unlimited | n; chosen by the researcher, with n ≤ N |
| Numerical summaries | Parameters: fixed and usually unknown | Statistics: known, and different from sample to sample |
| Mean | μ = Σxᵢ / N | x̄ = Σxᵢ / n |
| Variance | σ² = Σ(xᵢ − μ)² / N | s² = Σ(xᵢ − x̄)² / (n − 1) |
| Standard deviation | σ = √σ² | s = √s² |
| Proportion | p | p̂ |
| Data collection | Census | Sampling: simple random, stratified, cluster and so on |
| Type of analysis | Descriptive: the summaries are exact | Inferential: estimates carry a margin of error |
The n − 1 in the sample variance is the one difference that changes the arithmetic. Deviations are measured from x̄, which sits closer to the sample’s own values than μ does, so dividing by n would underestimate the population variance on average. Dividing by n − 1 corrects for that. The guide Sample vs Population Standard Deviation: Which Should You Use? works through the reasoning, and Parameter vs Statistic: Difference, Symbols and Examples covers the notation in full.
Population variance vs sample variance: one dataset, two answers
Take the commute times of a firm’s 8 employees: 12, 18, 25, 30, 34, 41, 45 and 55 minutes. The mean is 260 / 8 = 32.5 and the squared deviations from it add up to Σ(xᵢ − x̄)² = 1,430.
| Treated as | Divide by | Variance | Standard deviation |
|---|---|---|---|
| Population (the question is about these 8 people) | N = 8 | σ² = 1,430 / 8 = 178.75 | σ = 13.37 |
| Sample (the 8 stand in for a larger workforce) | n − 1 = 7 | s² = 1,430 / 7 = 204.29 | s = 14.29 |
Here the sample standard deviation is about 7% larger than the population one (the variance about 14%). The gap shrinks as n grows: with 100 values the standard deviations differ by about 0.5%, which is why the choice matters most for small datasets.
Population proportion vs sample proportion
For yes-or-no data the parameter is the population proportion p, and the statistic is the sample proportion p̂ = x / n, where x is the number of “yes” answers in the sample. Suppose 102 of the firm’s 340 employees cycle to work, so p = 102 / 340 = 0.30. A random sample of 60 that contains 21 cyclists gives p̂ = 21 / 60 = 0.35. The 0.05 gap is sampling error, and its typical size is the standard error √[p(1 − p) / n] = √(0.30 × 0.70 / 60) ≈ 0.059. Both proportions use the same formula; only the group they are computed over differs.
Try it: Standard Deviation CalculatorPaste a dataset and switch between the sample (n − 1) and population (N) formulas to see how far the two standard deviations differ.Why we sample instead of measuring everyone
- Cost and time. Interviewing 1,200 voters takes days. Interviewing every voter is a national election.
- Access. Many populations cannot be listed or reached: future customers, all the fish in a lake, every patient who will ever take a drug.
- Destructive measurement. Testing how long a battery lasts uses it up. A census would leave nothing to sell.
- Quality. With fewer units to measure, more care can go into each measurement and into following up people who do not respond.
- Enough precision. Precision depends mainly on the sample size, not on the fraction of the population sampled, so a well-drawn sample of about a thousand people describes a country nearly as precisely as it describes a city.
A census is the right choice when the population is small and fully accessible, such as one class or one team, or when every unit needs its own answer.
Sampling methods in brief
How a sample is chosen matters more than how big it is. Probability sampling gives every member a known chance of selection, which is what the formulas for margins of error and p-values assume.
| Method | How it works | Use it when |
|---|---|---|
| Simple random | Every member has the same chance: number the frame 1 to N and draw n numbers without repeats | You have a complete list of the population |
| Stratified | Split the population into groups (strata), such as age bands, and sample randomly within each | The groups differ and each must be represented |
| Cluster | Randomly select whole groups, such as schools or city blocks, and measure the members of those groups | No list of individuals exists, or travel between units is costly |
| Systematic | Pick a random start, then take every k-th member, with k = N / n | Units arrive in sequence, as on a production line |
| Convenience | Take whoever is easiest to reach: volunteers, passers-by, online respondents | Pilot work only; it is not a probability sample |
For a simple random sample, the Random Number Generator can draw n distinct whole numbers between 1 and N; the members with those numbers form the sample. Systematic sampling is safe unless the list has a cycle that matches k, as when every seventh day of daily sales always lands on a Saturday.
Try it: Random Number GeneratorGenerate n distinct whole numbers between 1 and your population size to pick the members of a simple random sample.Population vs representative sample
A representative sample is one whose make-up matches the population on the characteristics that affect the answer, such as age, region or product line. Every sample is part of a population, but only a representative one lets its statistics stand in for the parameters.
- Random selection makes a sample representative on average, including on traits nobody thought to measure. Any single random sample can still be off by chance; that is sampling error, and the margin of error quantifies it.
- Stratified sampling guarantees the proportions on the traits you stratify by. If 30% of a company’s staff work night shifts, a stratified sample of 60 includes exactly 18 night-shift workers.
- Quota and convenience samples can match the population on a few listed traits and still miss on others, because who ends up in them is not left to chance. They look representative without being so.
To check a sample, compare its known traits with figures for the whole population, for example its age and sex split against census data. A close match is reassuring but not proof; a clear mismatch means the results should be weighted or treated with caution.
Describing the population and sample in a research paper
Theses, survey reports and journal articles are expected to state who the results apply to. Researchers often split the population into two layers: the target population, the group the conclusions are meant for, and the accessible population, the part of it that can actually be reached and listed in a sampling frame.
- Target population: who, where and when, e.g. “full-time undergraduate students at public universities in Ohio, autumn 2026”.
- Accessible population and sampling frame: e.g. “students enrolled at the three universities that shared their registry lists”.
- Sampling method: simple random, stratified, cluster, systematic or a non-probability method, with the reason for the choice.
- Sample size and how it was set: the planned n, the margin of error or power calculation behind it, and the number who actually took part (the response rate).
- Limits on generalising: any part of the target population the frame or the responses did not cover.
Stating these five points lets a reader judge how far the sample results can be stretched to the population, which is the question every population vs sample decision comes back to.
Sampling error vs bias
A sample statistic almost never equals the population parameter exactly. The gap has two sources that behave very differently.
Sampling error is the chance variation that comes from observing some members and not others. Suppose a firm’s 8 employees have commute times of 12, 18, 25, 30, 34, 41, 45 and 55 minutes, so the population mean is μ = 260 / 8 = 32.5. A random sample of three might be 18, 34 and 55, with x̄ = 35.67, or 12, 25 and 41, with x̄ = 26.0. Across all 56 possible samples of three, the sample mean ranges from 18.33 to 47.0, yet the average of those 56 means is exactly 32.5. Random sampling is right on average, and its errors shrink as n grows: with samples of six, the possible means range only from 26.67 to 38.33.
Bias is a systematic error built into how the sample is selected or measured. If the firm surveyed only the employees found in the car park at 8 a.m., people who cycle or work late shifts would be missing, and the estimate would be off in the same direction every time. Common forms are selection bias, non-response bias and voluntary-response bias.
How the sample size is chosen
The sample size follows from how precise the answer has to be. For estimating a proportion from a simple random sample, the standard formula is n = z² · p(1 − p) / e², where e is the margin of error and z reflects the confidence level.
- At 95% confidence with p = 0.5, a margin of error of ±5 percentage points needs n = 385, and ±3 points needs n = 1,068.
- Halving the margin of error roughly quadruples n, because precision improves with √n.
- Population size matters only when the sample is a sizeable share of it. For N = 2,000 the finite population correction lowers 385 to 323; for N = 1,000,000 the answer is still 385.
- Studies that compare groups are sized differently, from the smallest difference worth detecting and the power required; see Type I vs Type II Errors (Type 1 vs Type 2): Definitions and Examples.
The Sample Size Calculator handles both kinds of study, the Cochran’s Formula Calculator shows the survey formula step by step, and the Margin of Error Calculator works backwards from a sample you already have.
How to tell if your data are a sample or a population
The deciding factor is the conclusion you want to draw, not the size of the dataset. Work through three questions:
- Which group is the conclusion about? Name it precisely: “the 28 students in this class” and “students taking this course in general” are different groups.
- Do the data cover every member of that group? If yes, they are population data. If some members are missing, or the group includes future or unreachable members, they are sample data.
- Will you generalise beyond the data? Any statement about members you did not measure, including forecasts, makes the data a sample and calls for sample formulas and a measure of uncertainty.
A common sample vs population data puzzle is a dataset that is 100% complete, such as every transaction a shop recorded last year. For reporting what happened last year it is population data, and its mean is exact. For judging whether a new layout raised spending, the year is one sample of what the shop’s customers could have done, and a hypothesis test treats it that way.
Classifying five scenarios
Problem. For each scenario, decide whether the data are a population or a sample, and which summary values apply.
- 01A teacher averages the final grades of all 28 students in the class to report the class mean. The conclusion is about these 28 students and all are included: a population. The mean is μ, and the standard deviation divides by N.
- 02A polling firm phones 1,200 registered voters to estimate support for a proposal. The conclusion is about all registered voters: a sample. The result is p̂ and needs a margin of error.
- 03A quality engineer weighs 40 cereal boxes from today’s run to check the filling machine. The conclusion is about everything the machine produces: a sample. Use x̄ and s, dividing by n − 1.
- 04A national census records the age of every resident. Every member is measured: a population. The mean age is a parameter with no sampling error, although measurement error remains.
- 05An analyst records the points a player scored in each of last season’s 82 games. For describing that season, the 82 games are a population. For predicting next season, the same 82 values are a sample of the player’s underlying performance.
Answer. Populations: the class grades, the census, and the season described on its own terms. Samples: the poll, the cereal boxes, and the season used for prediction. Whenever the data are a sample, report the statistics with a measure of uncertainty, such as a confidence interval.
When in doubt, treat the data as a sample. It is the more common situation, and for large n the two sets of formulas give almost the same numbers.
Frequently asked questions
What is an example of a population and a sample?
What is the difference between a population and a sample?
How do I know if my data is a sample or a population?
Why is a sample used instead of a population?
What is the difference between a population and a representative sample?
Is a population always large?
What do N and n mean in statistics?
Why is a random sample important?
How large should a sample be?
What is the difference between sampling error and sampling bias?
Further reading
Cite this page
Statculator. (2026, November 14). Population vs Sample: Definitions, Differences and Examples. Retrieved November 14, 2026, from https://statculator.com/learn/population-vs-sample/