Sample vs Population Standard Deviation: Which Should You Use?
Sample vs population standard deviation: when to divide by N or n − 1, why Bessel’s correction works, a worked example, and STDEV.S vs STDEV.P.
By Hira Noor, BS Mathematics · Updated · 8 min read
Summary
Use the population standard deviation σ, which divides by N, when your data include every member of the group you want to describe. Use the sample standard deviation s, which divides by n − 1, when your data are a sample and you want to estimate the spread of a larger population. The n − 1 divisor, called Bessel’s correction, makes the sample variance an unbiased estimate of the population variance.
Key takeaways
- Population SD: σ = √[Σ(x − μ)² / N]. Sample SD: s = √[Σ(x − x̄)² / (n − 1)].
- Use n − 1 when the data are a sample used to generalize; use N when they are the entire population of interest.
- Bessel’s correction compensates for measuring deviations from x̄ instead of the unknown μ.
- The gap shrinks as n grows: on the same data, s is 5.4% larger than σ at n = 10 and 0.5% larger at n = 100.
- Check software defaults: NumPy’s std divides by n, while Excel’s STDEV.S, R’s sd and pandas divide by n − 1.
On this page
- What population and sample mean in standard deviation
- The two formulas
- Why the sample formula divides by n − 1
- Worked example: both formulas on the same data
- Should you use sample or population standard deviation?
- Sample and population SD in software
- How much difference does n − 1 make?
- Common mistakes
- Frequently asked questions
What population and sample mean in standard deviation
A population is every member of the group you want to describe: all employees of one company, every sale made last year, all parts in a finished batch. A sample is the subset you actually measured, usually because measuring everyone is too costly or impossible. The full distinction is covered in Population vs Sample: Definitions, Differences and Examples.
The population standard deviation σ is a fixed number that describes the spread of the whole group. The sample standard deviation s is calculated from the sample and estimates σ. σ is a parameter and s is a statistic; see Parameter vs Statistic: Difference, Symbols and Examples for the other symbol pairs such as μ and x̄. The labels describe the role of the data, not their size: the same ten numbers are a population if they are the only ten you care about, and a sample if they stand in for a larger group.
The two formulas
Both formulas measure the typical distance of values from their mean. They differ in which mean they use and in what they divide by.
| Feature | Population | Sample |
|---|---|---|
| Symbol | σ (sigma) | s |
| Mean used | μ, the population mean | x̄, the sample mean |
| Divisor | N, the number of values | n − 1, the degrees of freedom |
| Variance | σ² = SS / N | s² = SS / (n − 1) |
| Purpose | Describe a complete population exactly | Estimate σ from part of the population |
SS is the sum of squared deviations, Σ(x − mean)². The square root is taken last, after dividing, so the standard deviation is in the same units as the data.
Try it: Standard Deviation CalculatorHave data already? Paste it into the standard deviation calculator to get s and σ at once.Why the sample formula divides by n − 1
The sample mean x̄ is calculated from the same data, so it sits right in the middle of them. In fact x̄ is the single number that makes the sum of squared deviations as small as possible: deviations from any other number, including the true μ, are larger. Measuring spread around x̄ therefore understates the spread around μ, and dividing by n gives a variance that is too small on average.
Dividing by n − 1 instead of n enlarges the result by exactly the factor n / (n − 1) needed to remove that bias. This adjustment is Bessel’s correction. Degrees of freedom give a second way to see it: the n deviations from x̄ always sum to zero, so once n − 1 of them are known the last one is fixed. Only n − 1 deviations carry independent information about spread.
This identity, which holds for independent observations from any population with a finite variance, is the whole argument in one line. The sum of squares around x̄ averages (n − 1) times σ², not n times σ², so dividing it by n − 1 gives σ² on average. It does not rely on the data being normal.
Seeing the bias in every possible sample
Problem. A tiny population has three values, 2, 4 and 6, so μ = 4 and σ² = (4 + 0 + 4) / 3 = 2.6667. List every sample of size 2 drawn with replacement and average the two versions of the variance.
- 01There are 3 × 3 = 9 equally likely ordered samples: (2, 2), (2, 4), (2, 6), (4, 2), (4, 4), (4, 6), (6, 2), (6, 4), (6, 6).
- 02Dividing by n = 2, the nine variances are 0, 1, 4, 1, 0, 1, 4, 1, 0. Their average is 12 / 9 = 1.3333.
- 03Dividing by n − 1 = 1, the nine variances are 0, 2, 8, 2, 0, 2, 8, 2, 0. Their average is 24 / 9 = 2.6667.
Answer. Only the n − 1 version averages to the true σ² = 2.6667; the divide-by-n version is too small by the factor (n − 1) / n = 1/2. That is what “unbiased” means: correct on average across all possible samples.
Worked example: both formulas on the same data
A support team logs the number of tickets each agent closed on Monday: 4, 8, 6, 5, 3, 10.
Population and sample SD of 4, 8, 6, 5, 3, 10
Problem. Compute both standard deviations, then decide which one answers the question being asked.
- 01Mean: (4 + 8 + 6 + 5 + 3 + 10) / 6 = 36 / 6 = 6.
- 02Deviations from the mean: −2, 2, 0, −1, −3, 4.
- 03Squared deviations: 4, 4, 0, 1, 9, 16, so SS = 34.
- 04Population: σ² = 34 / 6 = 5.6667 and σ = √5.6667 = 2.3805.
- 05Sample: s² = 34 / 5 = 6.8 and s = √6.8 = 2.6077.
Answer. If the six agents are the whole team and you only want to describe Monday’s spread for this team, report σ = 2.3805. If the six were picked from a 200-person support centre to estimate variability across all agents, report s = 2.6077.
Should you use sample or population standard deviation?
Ask one question: do I want to describe these values only, or use them to learn about a larger group? The answer depends on the purpose of the analysis, not on how many values you have.
| Situation | Use | Why |
|---|---|---|
| Final exam scores of every student in your class, reported for that class | σ (divide by N) | The class is the whole population of interest |
| Scores of 50 students sampled to estimate variability across a school district | s (divide by n − 1) | The 50 are a sample of a larger population |
| Monthly sales for all 12 months of last year, describing last year | σ | Every month of interest is included |
| Sales from 30 days used to judge future day-to-day variability | s | The days are treated as a sample from an ongoing process |
| Measurements of parts taken from a production run | s | The parts measured stand for the process that made them |
| Inputs to a t-test, confidence interval or ANOVA | s | These methods are built on the sample estimate |
When in doubt, use s. Most real datasets are samples, t-based tests and intervals expect s, and for large n the two values are nearly identical anyway. For more on the distinction between describing data and generalizing from it, see Descriptive vs Inferential Statistics: Differences and Examples.
Sample and population SD in software
Function names differ between tools, and so do the defaults.
| Software | Sample SD (n − 1) | Population SD (n) | Note |
|---|---|---|---|
| Excel and Google Sheets | STDEV.S(range) | STDEV.P(range) | The older STDEV is the sample version and STDEVP the population version |
| Python statistics module | statistics.stdev(data) | statistics.pstdev(data) | Separate functions, so there is no default to remember |
| NumPy | np.std(x, ddof=1) | np.std(x) | The default ddof=0 is the population formula |
| pandas | Series.std() | Series.std(ddof=0) | The default ddof=1 is the sample formula |
| R | sd(x) | No built-in function | Multiply sd(x) by √((n − 1) / n) |
| TI-83/84 (1-Var Stats) | Sx | σx | Both appear on the same output screen |
When to use STDEV.S vs STDEV.P
Use STDEV.S when the cells hold a sample and you want to estimate the spread of a larger group, which covers survey responses, experiment results, quality-control measurements and most coursework. Use STDEV.P only when the cells hold every value in the group you are describing, such as the salaries of all twelve people in one office. For the ticket data above, =STDEV.S(A1:A6) returns 2.6077 and =STDEV.P(A1:A6) returns 2.3805. Google Sheets uses the same two function names, and the matching variance functions are VAR.S and VAR.P.
How much difference does n − 1 make?
On the same data, s is always larger than the divide-by-n value by the factor √[n / (n − 1)]. The gap matters for small samples and fades quickly as n grows.
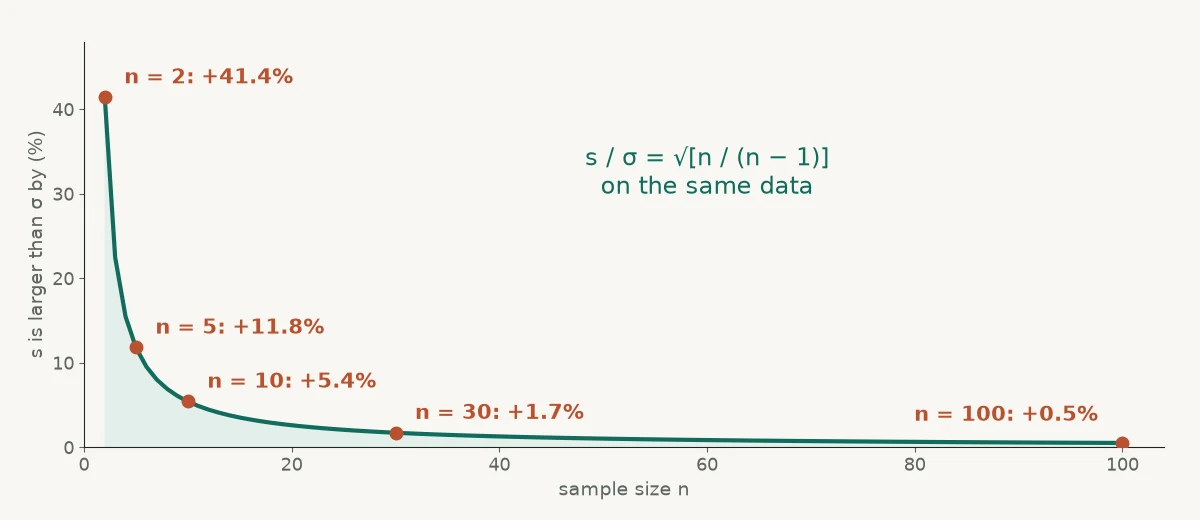
| n | s / σ | s is larger by |
|---|---|---|
| 2 | 1.4142 | 41.4% |
| 5 | 1.1180 | 11.8% |
| 10 | 1.0541 | 5.4% |
| 30 | 1.0171 | 1.7% |
| 100 | 1.0050 | 0.5% |
| 1,000 | 1.0005 | 0.05% |
In the ticket example, n = 6 and the ratio is √(6/5) = 1.0954, which matches 2.6077 / 2.3805. The same n − 1 idea carries over to related formulas such as the variance, the standard error s / √n and the pooled standard deviation.
Common mistakes
- Choosing by dataset size. A small dataset can be a population (the five members of a committee), and a large one can be a sample (10,000 transactions drawn from a payment system).
- Applying n − 1 when μ is known. If the true population mean μ is known, deviations from μ divided by n already give an unbiased variance estimate. The n − 1 correction is needed only because x̄ is estimated from the same data.
- Trusting calculator defaults. Check which key or function you used: Sx or σx on a TI-84,
STDEV.SorSTDEV.Pin Excel, and theddofsetting in NumPy. - Plugging σ into a t-test. t-tests and t intervals are derived for the sample SD s. Use a z-test only when σ is genuinely known from outside the sample.
Frequently asked questions
What is the difference between sample and population standard deviation?
Why do we divide by n − 1 for a sample?
Is the sample standard deviation always larger than the population standard deviation?
Should I use STDEV.S or STDEV.P in Excel?
Which standard deviation does NumPy calculate?
np.std uses the population formula by default (ddof=0, dividing by n). Pass ddof=1 to get the sample standard deviation. pandas does the opposite: Series.std() defaults to ddof=1.What do Sx and σx mean on a TI-84?
Does the choice matter for large datasets?
Further reading
Cite this page
Statculator. (2026, November 14). Sample vs Population Standard Deviation: Which Should You Use?. Retrieved November 14, 2026, from https://statculator.com/learn/sample-vs-population-standard-deviation/