Measures of Central Tendency: Mean, Median and Mode
Measures of central tendency explained: how to find the mean, median and mode, which measure of center is best, and how skew and outliers affect each.
By Hira Noor, BS Mathematics · Updated · 11 min read
Summary
Measures of central tendency (also called measures of center) are single values that describe the center of a dataset. There are three main ones: the mean (the sum of the values divided by how many there are), the median (the middle value of the sorted data) and the mode (the most frequent value). The mean suits symmetric numeric data, the median suits skewed data or data with outliers, and the mode is the only choice for categories.
Key takeaways
- Mean = Σx / n; median = the middle of the sorted values; mode = the most frequent value.
- The mean uses every value, so a single outlier can move it a long way. The median and mode barely react.
- In right-skewed data the mean usually lies above the median; in left-skewed data it lies below.
- Nominal data: mode. Ordinal data: median or mode. Interval and ratio data: mean if symmetric, median if skewed.
- For a grouped frequency table, the mean uses class midpoints and the median and mode are interpolated within a class.
- Weighted, geometric, harmonic and trimmed means and the midrange handle unequal weights, growth, rates and outliers.
On this page
- What is a measure of central tendency?
- Mean, median and mode: definitions and formulas
- Worked example: finding all three
- Examples of central tendency in real data
- Mean, median and mode for grouped data
- How outliers and skew affect the mean, median and mode
- What is the best measure of central tendency?
- Other measures of center: special means and the midrange
- Common mistakes
- Frequently asked questions
What is a measure of central tendency?
A measure of central tendency answers the question “what is a typical value?” with one number. Statisticians also call it a measure of center or a measure of location, because it locates the middle of a distribution on the number line. Together with a measure of spread, such as the range or the standard deviation, it is one of the two basic summaries in descriptive statistics.
There are three main measures of central tendency: the mean, the median and the mode. Each defines “typical” in a different way, which is why they can disagree for the same data. Less common measures of center, such as the weighted mean, the geometric mean, the trimmed mean and the midrange, are covered later in this guide. To get all three for your own numbers at once, paste them into the Mean, Median, Mode Calculator.
Mean, median and mode: definitions and formulas
Mean
The mean (the arithmetic mean, or average) is the sum of the values divided by the number of values. It is the balance point of the data: the deviations above it and the deviations below it add up to zero. The sample mean is written x̄ and the population mean μ, a distinction explained in Parameter vs Statistic: Difference, Symbols and Examples.
Median
The median is the middle value once the data are sorted. Half of the values lie at or below it and half at or above it. With n sorted values, the median sits at position (n + 1) / 2: for an odd n that is a single value, and for an even n it falls between two values, so the median is their mean. The Median Calculator sorts the data and shows the position for you.
Mode
The mode is the value that occurs most often. A dataset can have one mode (unimodal), two (bimodal) or more (multimodal), and it has no mode when every value appears equally often. The mode is the only one of the three that works for non-numeric categories, such as the most common blood type or the best-selling colour. The Mode Calculator lists every mode and its frequency.
| Measure | How to find it | Uses every value? | Affected by outliers? |
|---|---|---|---|
| Mean | Add the values and divide by n | Yes | Strongly |
| Median | Sort the values and take the middle one | No, only their order | Hardly at all |
| Mode | Count how often each value occurs and take the most frequent | No | No |
Worked example: finding all three
Books read last month
Problem. Ten members of a reading club report how many books they read last month: 3, 9, 5, 3, 2, 7, 4, 3, 8, 6. Find the mean, median and mode.
- 01Mean. Add the values: 3 + 9 + 5 + 3 + 2 + 7 + 4 + 3 + 8 + 6 = 50. Divide by n = 10: x̄ = 50 / 10 = 5.
- 02Median. Sort the data: 2, 3, 3, 3, 4, 5, 6, 7, 8, 9. With n = 10 the median is at position (10 + 1) / 2 = 5.5, halfway between the 5th and 6th values: (4 + 5) / 2 = 4.5.
- 03Mode. Count each value: 3 occurs three times and every other value once, so the mode is 3.
Answer. Mean = 5, median = 4.5, mode = 3. The three differ because the data are slightly right-skewed: most members read between 2 and 5 books, and a few read more.
Examples of central tendency in real data
Every “typical” figure you meet in the news or at work is a measure of central tendency. Which one is reported depends on the kind of data, as these examples show.
| Situation | Measure usually reported | Why |
|---|---|---|
| Household income | Median | Incomes are right-skewed; a few very high earners would pull the mean above what most households earn |
| House prices in an area | Median | A handful of expensive sales would distort the mean |
| Class score on an exam | Mean | Scores are usually roughly symmetric, and the mean uses every result |
| Daily temperature or rainfall over a month | Mean | Numeric measurements without extreme outliers |
| Shoe size a shop should stock most of | Mode | The shop needs the most common size, not an average size |
| Most popular answer in a survey | Mode | The answers are categories, which cannot be added or ranked |
| Customer satisfaction on a 1-to-5 scale | Median | The ratings are ordered, but the gaps between them are not equal |
Mean, median and mode for grouped data
When data arrive as a frequency table of single values, the same definitions apply. For the mean, multiply each value by its frequency, add the products and divide by the total frequency. For the median, count through the cumulative frequencies until you reach the middle position. The mode is the value with the largest frequency.
When the data are grouped into class intervals such as 40–49 and 50–59, the raw values are lost, so all three measures become estimates. The mean treats every value as if it sat at its class midpoint, and the median and mode are interpolated inside one class.
Here x is the class midpoint, L the lower boundary of the median (or modal) class, F the cumulative frequency before the median class, f the frequency of the median class, h the class width, and f₁, f₀ and f₂ the frequencies of the modal class, the class before it and the class after it.
Exam scores of 40 students
Problem. Scores are grouped as 40–49 (4 students), 50–59 (8), 60–69 (14), 70–79 (10) and 80–89 (4). Estimate the mean, median and mode.
- 01Mean. The midpoints are 44.5, 54.5, 64.5, 74.5 and 84.5. Σfx = 4(44.5) + 8(54.5) + 14(64.5) + 10(74.5) + 4(84.5) = 178 + 436 + 903 + 745 + 338 = 2,600. Mean ≈ 2,600 / 40 = 65.
- 02Median. n/2 = 20. The cumulative frequencies are 4, 12, 26, …, so the 20th score lies in the 60–69 class. With L = 59.5, F = 12, f = 14 and h = 10: median ≈ 59.5 + (20 − 12) / 14 × 10 = 59.5 + 5.71 = 65.21.
- 03Mode. The modal class is 60–69 (f₁ = 14), with f₀ = 8 before it and f₂ = 10 after it: mode ≈ 59.5 + (14 − 8) / (28 − 8 − 10) × 10 = 59.5 + 6 = 65.5.
Answer. Mean ≈ 65, median ≈ 65.21, mode ≈ 65.5. The three are close because the distribution is nearly symmetric.
How outliers and skew affect the mean, median and mode
Suppose the member who read 9 books had read 39 instead. The data become 2, 3, 3, 3, 4, 5, 6, 7, 8, 39.
| Measure | Original data | With 39 in place of 9 | Change |
|---|---|---|---|
| Mean | 5 | 8 | +3 |
| Median | 4.5 | 4.5 | None |
| Mode | 3 | 3 | None |
One changed value lifts the mean from 5 to 8, a figure that eight of the ten members fall below. The median and the mode do not move. A measure that resists extreme values in this way is called robust. The mean is not robust, because every value enters the sum with equal weight however far out it lies.
Skew produces the same pull in a milder, systematic form. In a right-skewed (positively skewed) distribution, with a long tail of large values, the tail drags the mean above the median. In a left-skewed (negatively skewed) distribution the mean falls below it. In a symmetric distribution with a single peak, all three coincide.
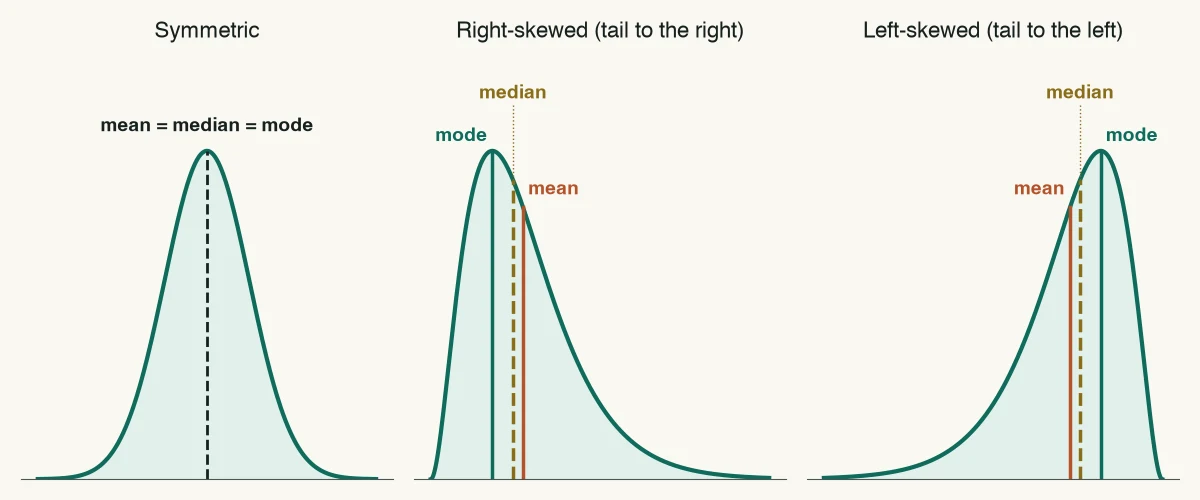
| Shape | Typical order | Example data | Mean, median, mode |
|---|---|---|---|
| Symmetric | mean = median = mode | 4, 5, 5, 6, 6, 6, 7, 7, 8 | 6, 6, 6 |
| Right-skewed (tail to the right) | mode < median < mean | 2, 3, 3, 3, 4, 5, 6, 7, 8, 9 | 5, 4.5, 3 |
| Left-skewed (tail to the left) | mean < median < mode | 45, 62, 70, 74, 78, 80, 82, 85, 85, 89 | 75, 79, 85 |
The ordering is a tendency, not a law, and it can fail for discrete data or data with several peaks. To measure asymmetry directly, use the Skewness Calculator; to see it, draw a histogram or a box plot.
What is the best measure of central tendency?
No single measure is best for every dataset. The best measure of central tendency depends on two things: the level of measurement of the variable and, for numeric data, the shape of the distribution. For symmetric numeric data the mean is usually best; for skewed data or data with outliers, the median; for categories, the mode.
| Data | Example | Best measure | Why |
|---|---|---|---|
| Nominal (unordered categories) | Blood type, favourite colour | Mode | Categories cannot be added or ranked |
| Ordinal (ordered categories) | Satisfaction from 1 to 5, education level | Median (the mode is also valid) | Order is meaningful, but the gaps between levels are not |
| Interval or ratio, roughly symmetric | Heights, exam scores, measurement error | Mean | Uses all the information and pairs with the standard deviation |
| Interval or ratio, skewed or with outliers | Incomes, house prices, waiting times | Median | Not pulled by the long tail |
| Interval or ratio, two or more peaks | Heights of a mixed group of adults and children | The modes, or analyse the groups separately | No single center describes the data |
Ordinal data show why the choice matters. Take 50 survey ratings on a 1-to-5 scale: 3 ones, 5 twos, 12 threes, 18 fours and 12 fives. The mode is 4, and the median, halfway between the 25th and 26th ratings, is also 4. Both are sound summaries of ordered categories. The mean of 3.62 is often quoted as well, but it treats the labels as evenly spaced numbers.
When the mean and median differ noticeably, report both: the gap itself tells readers the distribution is skewed. Pair each center with a matching measure of spread, the mean with the standard deviation and the median with the interquartile range.
The mean has one advantage the others lack: it works with totals. The mean times n recovers the sum, so the mean is the right figure for budgeting or forecasting even when the data are skewed, and it is the quantity that t-tests, ANOVA and regression are built on.
Other measures of center: special means and the midrange
The arithmetic mean assumes that every value counts equally and that values combine by addition. These variants relax those assumptions or trade information for simplicity.
- Weighted mean:
Σwᵢxᵢ / Σwᵢ, for values that carry different importance. An exam worth 50% scored 80, homework worth 30% scored 90 and a quiz worth 20% scored 70 give 0.5 × 80 + 0.3 × 90 + 0.2 × 70 = 81. Use the Weighted Mean Calculator. - Geometric mean: the n-th root of the product of n values, for growth rates and ratios that compound. Growth factors of 1.10, 1.20 and 0.90 over three years have a geometric mean of 1.0591, an average growth of 5.91% a year; the arithmetic mean of 6.67% would overstate it. Use the Geometric Mean Calculator.
- Harmonic mean:
n / Σ(1 / xᵢ), for rates measured over equal distances or equal amounts of work. Driving out at 40 km/h and back at 60 km/h along the same road averages 48 km/h, not 50. Use the Harmonic Mean Calculator. - Trimmed mean: the mean after removing a fixed percentage of the smallest and largest values, a compromise between the mean and the median. A 10% trimmed mean of the outlier data above drops the 2 and the 39 and averages the other eight values: (3 + 3 + 3 + 4 + 5 + 6 + 7 + 8) / 8 = 4.875. Use the Trimmed Mean Calculator.
- Midrange:
(min + max) / 2, the point halfway between the smallest and largest values. It is quick but the least robust measure of all: for the book data it is (2 + 9) / 2 = 5.5, and with the outlier it jumps to (2 + 39) / 2 = 20.5. Use the Midrange Calculator.
For positive values that are not all equal, the three classical means always fall in the order harmonic < geometric < arithmetic. The Arithmetic Mean Calculator shows them side by side.
Common mistakes
- Reporting only the mean for skewed data. A mean income or mean house price sits above what most people earn or pay. Give the median, or both.
- Averaging ordinal codes as if they were measurements. Averaging ratings on a 1-to-5 scale assumes the step from 1 to 2 equals the step from 4 to 5. The median category is the safer summary.
- Forgetting to sort before finding the median. The middle value of an unsorted list is not the median.
- Taking one middle value when n is even. An even number of values has two middle values, and the median is their mean.
- Averaging averages. The mean of several group means equals the overall mean only when the groups are the same size. Otherwise weight each group mean by its n.
- Using the arithmetic mean for growth rates or speeds. Compounding growth needs the geometric mean, and speeds over equal distances need the harmonic mean.
- Treating grouped-data results as exact. A mean, median or mode estimated from class intervals is an approximation; report it as one.
- Saying “average” without naming the measure. Mean, median and mode can all be called averages, and for skewed data they give different answers.
Frequently asked questions
How many main measures of central tendency are there?
What is an example of central tendency?
What is the best measure of central tendency?
When should I use the median instead of the mean?
Can a dataset have more than one mode, or no mode?
How do I find the median of an even number of values?
Which measure of central tendency is most affected by outliers?
Is the average the same as the mean?
Further reading
- OpenStax, Introductory Statistics 2e, 2.5 Measures of the Center of the Data
- OpenStax, Introductory Statistics 2e, 2.6 Skewness and the Mean, Median, and Mode
- NIST/SEMATECH e-Handbook of Statistical Methods, 1.3.5.1 Measures of Location
- Manikandan S. Measures of central tendency: The mean. J Pharmacol Pharmacother. 2011
Cite this page
Statculator. (2026, November 14). Measures of Central Tendency: Mean, Median and Mode. Retrieved November 14, 2026, from https://statculator.com/learn/measures-of-central-tendency/